WTI CRUDE OIL - WTI Slipped Below Our Suggested Level! - 11/30/2016 (GMT)
- Who voted?
- 811
- 0
- Timeframe : Daily

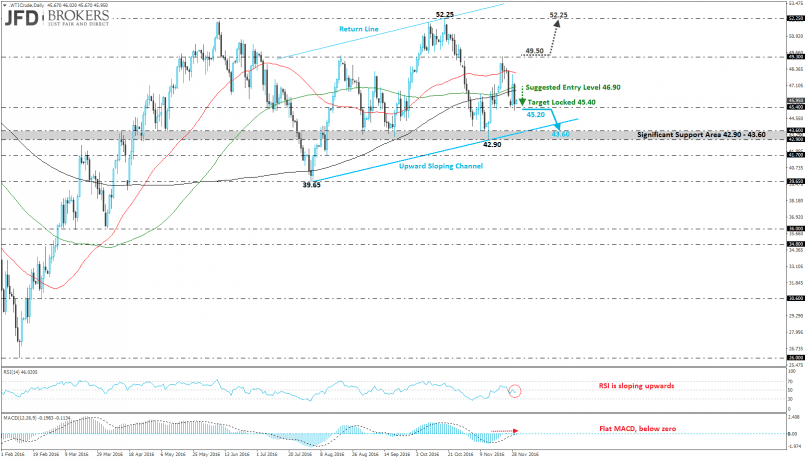
WTI CRUDE OIL Chart
Are you looking for opportunities in indices and forex?
DISCOVER LONDINIA OPPORTUNITIES...
DISCOVER LONDINIA OPPORTUNITIES...
The West Texas Intermediate (WTI) had a downward move over yesterday’s session meeting the $45.40 support level which overlaps with the 100-weekly SMA and hit our suggested target (see technical analysis here: http://bit.ly/2gercLa). Also, the oil plunged more than 3.5% and currently is trading near the $46.15 price level. The price fell below the 100-daily SMA and 200-daily SMA as the 50-SMA seems to be a critical obstacle for the bears. A break of the $45.40 obstacle will move towards the ascending trend line and the $43.60 support barrier.
On the other hand, if the oil surpasses above its moving averages will meet the $49.30 resistance level or the key resistance level at $52.25. Technical indicators seem to endorse with the downward thought as both are following a bearish path. the MACD oscillator lies near its mid-level with some weak momentum while the RSI indicator holds below the 50 level.
On the other hand, if the oil surpasses above its moving averages will meet the $49.30 resistance level or the key resistance level at $52.25. Technical indicators seem to endorse with the downward thought as both are following a bearish path. the MACD oscillator lies near its mid-level with some weak momentum while the RSI indicator holds below the 50 level.
This member did not declare if he had a position on this financial instrument or a related financial instrument.
About author

Offline


Add a comment
Comments
0 comments on the analysis WTI CRUDE OIL - Daily