WTI CRUDE OIL - First Target Locked at $54.70 - 02/28/2017 (GMT)
- Who voted?
- 516
- 0
- Timeframe : Daily

WTI CRUDE OIL Chart
Are you looking for opportunities in indices and forex?
DISCOVER LONDINIA OPPORTUNITIES...
DISCOVER LONDINIA OPPORTUNITIES...
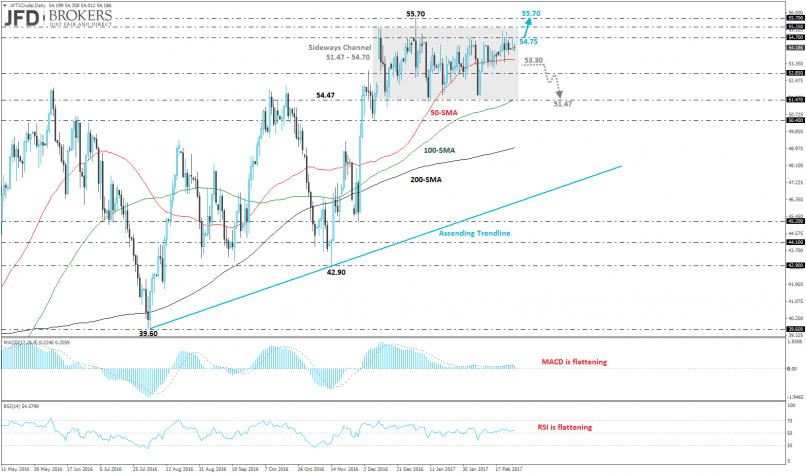
WTI Crude Oil remains within a sideways channel with upper band $54.70 and lower band $51.47 for more than 10 weeks. Founding significant support on the 50-SMA on the daily chart, the oil prices reached the upper boundary of the range, $54.70, as we suggested in a previous analysis, locking our first target (See the analysis here: http://bit.ly/2l2M3AE).
However, the black gold failed to surpass above it. If the bulls manage to push the commodity price above the aforementioned level, the next level to watch is $55.25. Otherwise, a drop below the 50-SMA, near $53.40 will slip the price towards the lower boundary of the sideways channel at $51.47. Both MACD and RSI are flattening giving no directional signal.
However, the black gold failed to surpass above it. If the bulls manage to push the commodity price above the aforementioned level, the next level to watch is $55.25. Otherwise, a drop below the 50-SMA, near $53.40 will slip the price towards the lower boundary of the sideways channel at $51.47. Both MACD and RSI are flattening giving no directional signal.
This member did not declare if he had a position on this financial instrument or a related financial instrument.
About author

Offline


Add a comment
Comments
0 comments on the analysis WTI CRUDE OIL - Daily