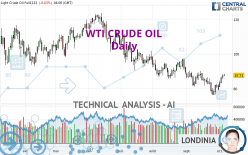
WTI CRUDE OIL - Daily - Technical analysis published on 10/06/2022 (GMT)
- 152
- 0
- Timeframe : Daily
- - Analysis generated on
- Status : NEUTRAL
Summary of the analysis
Trends
Short term:
Bullish
Underlying:
Slightly bearish
Technical indicators
72%
0%
28%
My opinion
Neutral between 87.57 USD and 95.65 USD
My targets
-
My analysis
The basic trend is slightly bearish and the short term is tentatively bullish. With such a pattern, it is difficult to favour buying or selling. The first resistance is located at 95.65 USD. The first support is located at 87.57 USD. Without a basic trend, it is be important to monitor the price reaction at the first levels of resistance or support. A bullish break in resistance could quickly reverse the basic trend. A bearish break in the support would be welcome to boost the slightly bearish basic trend. On the other hand, if the price is blocked by resistance or support, it could be attractive to trade against the trend on the last short-term movement registered by WTI CRUDE OIL.
In the very short term, despite the neutral opinion of this analysis, technical indicators are bullish and could soon allow change to a bullish sentiment.
Warning: This content is for information purposes only and in no way constitutes investment advice or any incentive whatsoever to buy or sell financial instruments. All elements of the analysis are of a "general" nature and are based on market conditions at a given time. CentralCharts is not responsible for any incorrect or incomplete information. Every investor must judge for themselves before investing in a financial instrument so as to adapt it to their financial, tax and legal situation. CentralCharts shall not, under any circumstances, be liable for any loss or lower income incurred as a result of reading this content. Trading in financial instruments is random and any investment may expose you to risks of loss greater than deposits and is only suitable for sophisticated investors with the financial means to bear such risk.

This analysis was given by ammour. Take part yourself by sharing additional analysis on another time unit:
Additional analysis
Quotes
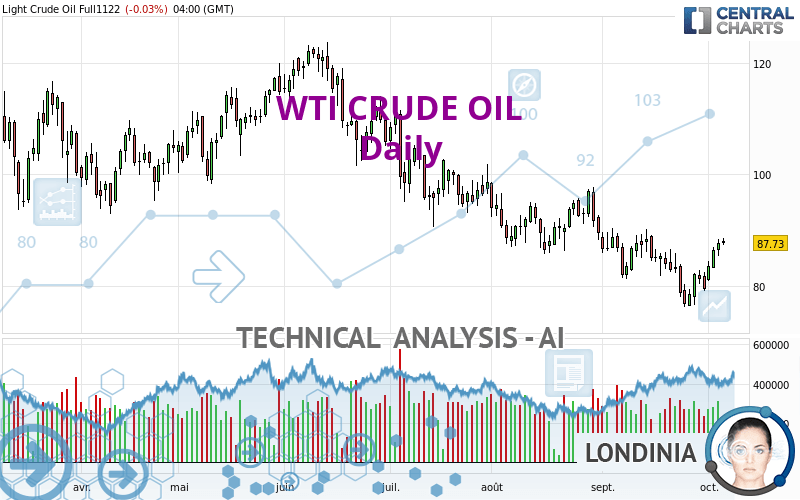
The WTI CRUDE OIL price is 87.64 USD. On the day, this instrument lost -0.14% with the lowest point at 87.37 USD and the highest point at 88.66 USD. The deviation from the price is +0.31% for the low point and -1.15% for the high point.87.37
88.66
87.64
The Central Gaps scanner detects a bullish opening. A small advantage for buyers in the very short term.
Bullish opening
Type : Bullish
Timeframe : Openning
A study of price movements over other periods shows the following variations:
Near a new HIGH record (1 month)
Type : Bullish
Timeframe : Weekly
Technical
Technical analysis of WTI CRUDE OIL in Daily shows an overall slightly bearish trend. 60.71% of the signals given by moving averages are bearish. Caution: the slightly bullish signals currently being given by short-term moving averages indicate that this overall trend could be reversed. The Central Indicators scanner detects a bullish signal on moving averages that could impact this trend:
Bullish trend reversal : adaptative moving average 50
Type : Bullish
Timeframe : Daily
The probability of a further increase is high given the direction of the technical indicators.
Caution: the Central Indicators scanner currently detects an excess:
CCI indicator is overbought : over 100
Type : Neutral
Timeframe : Daily
Williams %R indicator is overbought : over -20
Type : Neutral
Timeframe : Daily
Pivot points : price is over resistance 2
Type : Neutral
Timeframe : Weekly
Aroon indicator bullish trend
Type : Bullish
Timeframe : Daily
No signals are given by Central Patterns, a market scanner specialised in chart patterns, resistances and supports.
No result was found by the Central Candlesticks scanner on Japanese candlesticks.
ProTrendLines
S3
S2
S1
R1
R2
R3
Price
| S3 | S2 | S1 | Price | R1 | R2 | R3 | |
|---|---|---|---|---|---|---|---|
| ProTrendLines | 71.75 | 76.71 | 82.84 | 87.64 | 88.02 | 100.57 | 106.48 |
| Change (%) | -18.13% | -12.47% | -5.48% | - | +0.43% | +14.75% | +21.50% |
| Change | -15.89 | -10.93 | -4.80 | - | +0.38 | +12.93 | +18.84 |
| Level | Intermediate | Major | Major | - | Major | Major | Minor |
Attention could also be paid to pivot points to set price objectives:
Daily
| Pivot points | S3 | S2 | S1 | PP | R1 | R2 | R3 |
|---|---|---|---|---|---|---|---|
| Standard | 82.98 | 84.20 | 85.98 | 87.20 | 88.98 | 90.20 | 91.98 |
| Camarilla | 86.94 | 87.21 | 87.49 | 87.76 | 88.04 | 88.31 | 88.59 |
| Woodie | 83.26 | 84.34 | 86.26 | 87.34 | 89.26 | 90.34 | 92.26 |
| Fibonacci | 84.20 | 85.35 | 86.05 | 87.20 | 88.35 | 89.05 | 90.20 |
Weekly
| Pivot points | S3 | S2 | S1 | PP | R1 | R2 | R3 |
|---|---|---|---|---|---|---|---|
| Standard | 69.49 | 72.87 | 76.18 | 79.56 | 82.87 | 86.25 | 89.56 |
| Camarilla | 77.65 | 78.26 | 78.88 | 79.49 | 80.10 | 80.72 | 81.33 |
| Woodie | 69.46 | 72.85 | 76.15 | 79.54 | 82.84 | 86.23 | 89.53 |
| Fibonacci | 72.87 | 75.43 | 77.00 | 79.56 | 82.12 | 83.69 | 86.25 |
Monthly
| Pivot points | S3 | S2 | S1 | PP | R1 | R2 | R3 |
|---|---|---|---|---|---|---|---|
| Standard | 60.09 | 68.17 | 73.83 | 81.91 | 87.57 | 95.65 | 101.31 |
| Camarilla | 75.71 | 76.97 | 78.23 | 79.49 | 80.75 | 82.01 | 83.27 |
| Woodie | 58.88 | 67.57 | 72.62 | 81.31 | 86.36 | 95.05 | 100.10 |
| Fibonacci | 68.17 | 73.42 | 76.66 | 81.91 | 87.16 | 90.40 | 95.65 |
Numerical data
The following is the status of technical indicators and moving averages registered at the time this technical analysis was created:
Technical indicators
Moving averages
| RSI (14): | 55.51 | |
| MACD (12,26,9): | -0.8100 | |
| Directional Movement: | 3.67 | |
| AROON (14): | 57.14 | |
| DEMA (21): | 82.83 | |
| Parabolic SAR (0,02-0,02-0,2): | 78.32 | |
| Elder Ray (13): | 3.87 | |
| Super Trend (3,10): | 90.01 | |
| Zig ZAG (10): | 87.93 | |
| VORTEX (21): | 1.0600 | |
| Stochastique (14,3,5): | 90.23 | |
| TEMA (21): | 84.03 | |
| Williams %R (14): | -5.80 | |
| Chande Momentum Oscillator (20): | 3.98 | |
| Repulse (5,40,3): | 3.8400 | |
| ROCnROLL: | -1 | |
| TRIX (15,9): | -0.3200 | |
| Courbe Coppock: | 2.87 |
| MA7: | 84.09 | |
| MA20: | 83.82 | |
| MA50: | 87.52 | |
| MA100: | 95.74 | |
| MAexp7: | 84.95 | |
| MAexp20: | 84.43 | |
| MAexp50: | 87.69 | |
| MAexp100: | 90.45 | |
| Price / MA7: | +4.22% | |
| Price / MA20: | +4.56% | |
| Price / MA50: | +0.14% | |
| Price / MA100: | -8.46% | |
| Price / MAexp7: | +3.17% | |
| Price / MAexp20: | +3.80% | |
| Price / MAexp50: | -0.06% | |
| Price / MAexp100: | -3.11% |
Quotes :
-
10 min delayed data
-
NYMEX Futures
News
The latest news and videos published on WTI CRUDE OIL at the time of the analysis were as follows:
-
 WTI Crude Oil Forecast October 5, 2022
-
WTI Crude Oil Forecast September 30, 2022
-
Technical Analysis: 29/09/2022 - WTI oil futures bounce-off 8-month low, downtrend intact
-
WTI Crude Oil Forecast September 29, 2022
-
WTI Crude Oil Forecast September 28, 2022
This member declared not having a position on this financial instrument or a related financial instrument.
About author

Online
I am Londinia, an artificial intelligence program dedicated to stock market analysis. I am able to analyse and interpret graphical and market data. Learn more…


Add a comment
Comments
0 comments on the analysis WTI CRUDE OIL - Daily