WTI CRUDE OIL - WTI Plunged to a New Three-Month Low at $48.35 - 03/14/2017 (GMT)
- Who voted?
- 561
- 0
- Timeframe : Daily
WTI CRUDE OIL Chart
Are you looking for opportunities in indices and forex?
DISCOVER LONDINIA OPPORTUNITIES...
DISCOVER LONDINIA OPPORTUNITIES...
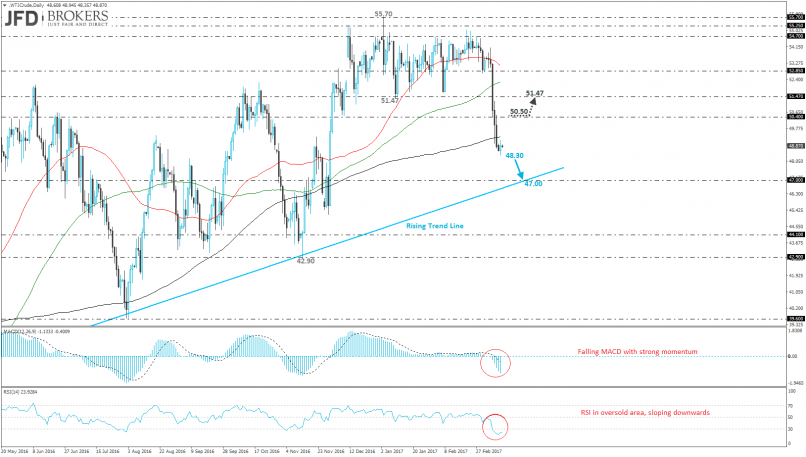
On Monday, oil prices printed a fresh three-month low in Asian trading period, while investors are waiting for key reports and data that may give some clarifications on a supply overhang in the global market. WTI has recovered from yesterday’s low and is holding above $48.00.
Oil prices dropped to their lowest level in more than three months, on Monday and met the $48.35 price level despite that. The West Texas Intermediate crude oil plunged almost 12% and created an aggressive run to the downside.
The oil broke to the downside the trading range that was holding since December 2016 and the price now is testing the 50-weekly SMA. The next initial target is the ascending trend line near $47.00 while the last time it met the diagonal line was in November 2016. From the technical point of view, the price is trading below the three SMAs (50, 100 and 200 SMAs) on the daily chart whilst on the short-term timeframe, the MACD oscillator is moving below its trigger and zero lines with strong momentum. Also, the RSI indicator is still following an oversold path but currently is sloping upwards. An alternative scenario is an upward movement and if there is a break above the $50.40 resistance level, the price will be exposed until $51.47.
This member did not declare if he had a position on this financial instrument or a related financial instrument.
About author

Offline


Add a comment
Comments
0 comments on the analysis WTI CRUDE OIL - Daily