WTI CRUDE OIL - Plummeted More Than 14% - New Almost 4-Month Low - 03/28/2017 (GMT)
- Who voted?
- 636
- 0
- Timeframe : Daily

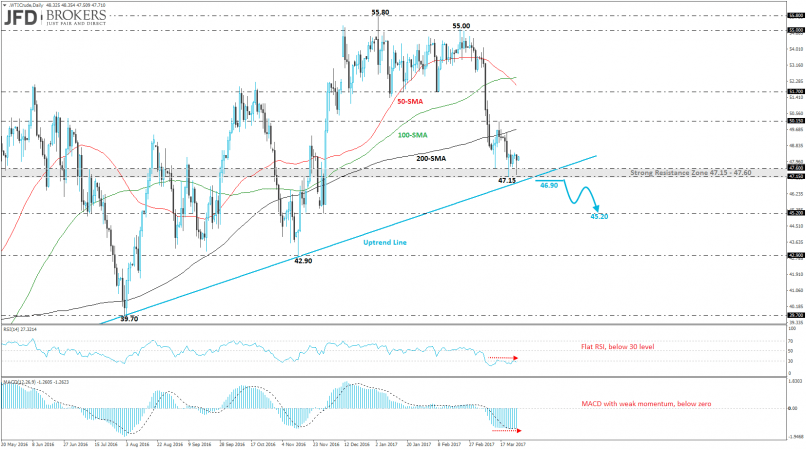
WTI CRUDE OIL Chart
Are you looking for opportunities in indices and forex?
DISCOVER LONDINIA OPPORTUNITIES...
DISCOVER LONDINIA OPPORTUNITIES...
Last week, the West Texas Intermediate crude oil printed a fresh almost four-month low and hit the $47.15 price level. The oil plummeted more than 14% during this month and is approaching the ascending trend line that is holding since April of 2016.
The last time that the price met the diagonal line was last November and if it slips below it, it will be exposed towards the $45.20 support level. From the technical point of view, the price is trading below the three SMAs (50, 100 and 200 SMAs) on the daily chart whilst on the 4-hour timeframe, the MACD oscillator is moving below the zero line with weak momentum. Also, the RSI indicator after the pullback on the 50 level, it lies sharply lower. Going back to the daily chart, RSI is flattening near the 30 level while MACD overlaps with its trigger line and is moving sideways.
The last time that the price met the diagonal line was last November and if it slips below it, it will be exposed towards the $45.20 support level. From the technical point of view, the price is trading below the three SMAs (50, 100 and 200 SMAs) on the daily chart whilst on the 4-hour timeframe, the MACD oscillator is moving below the zero line with weak momentum. Also, the RSI indicator after the pullback on the 50 level, it lies sharply lower. Going back to the daily chart, RSI is flattening near the 30 level while MACD overlaps with its trigger line and is moving sideways.
This member did not declare if he had a position on this financial instrument or a related financial instrument.
About author

Offline


Add a comment
Comments
0 comments on the analysis WTI CRUDE OIL - Daily