WTI CRUDE OIL - Posted a 10-Month Low And Started a Weak Retracement - 06/23/2017 (GMT)
- Who voted?
- 466
- 0
- Timeframe : Daily

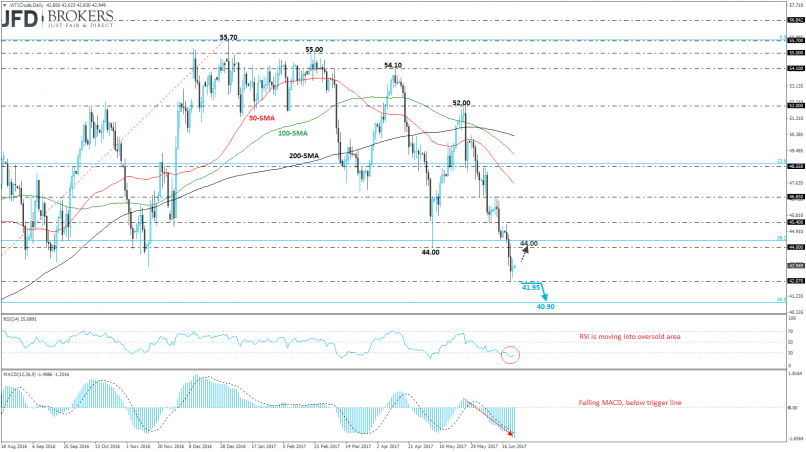
WTI CRUDE OIL Chart
Are you looking for opportunities in indices and forex?
DISCOVER LONDINIA OPPORTUNITIES...
DISCOVER LONDINIA OPPORTUNITIES...
The West Texas Intermediate (WTI) crude oil is printing the fifth consecutive bearish week and during this weekly period, it posted a ten-month low at $42.07 support level. The strong pullback from the $52.00 resistance barrier drove the oil sharply lower while it dropped more than 23% in five weeks. After, the crude oil’s new low, the price started a small correction to the upside as it completed a bullish day yesterday.
From a technical point of view, on the daily timeframe, the RSI indicator lies in the oversold area and is approaching the 30 line whilst the MACD oscillator fell beneath its trigger and zero lines. The next level to watch to the downside is the 50.0% Fibonacci retracement level, $40.90, of the upward move with low at $26.00 and high at $55.70. On the other side, if WTI continues its retracement we may see a climb at $44.00.
From a technical point of view, on the daily timeframe, the RSI indicator lies in the oversold area and is approaching the 30 line whilst the MACD oscillator fell beneath its trigger and zero lines. The next level to watch to the downside is the 50.0% Fibonacci retracement level, $40.90, of the upward move with low at $26.00 and high at $55.70. On the other side, if WTI continues its retracement we may see a climb at $44.00.
This member did not declare if he had a position on this financial instrument or a related financial instrument.
About author

Offline


Add a comment
Comments
0 comments on the analysis WTI CRUDE OIL - Daily