WTI CRUDE OIL - Is Extending Its Gains - Met Our Suggested Target! - 07/26/2017 (GMT)
- Who voted?
- 452
- 0
- Timeframe : Daily
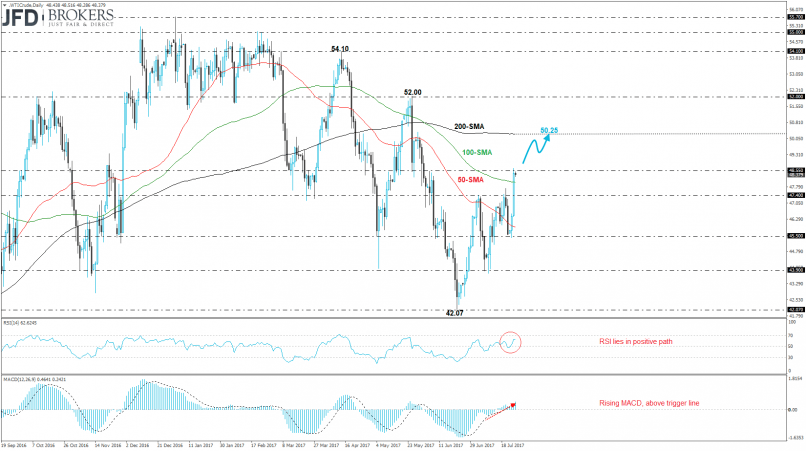
WTI CRUDE OIL Chart
Are you looking for opportunities in indices and forex?
DISCOVER LONDINIA OPPORTUNITIES...
DISCOVER LONDINIA OPPORTUNITIES...
The West Texas Intermediate (WTI) surged more than 6.6% over the last two days, while it hit and surpassed our recommended target at $48.12 price level (see technical analysis here: http://bit.ly/2t6pQWn). Oil prices printed an eight-week high at $48.66 after the announcement at a meeting of the OPEC and non-OPEC producers on Monday that it will limit the crude oil exports in August.
Technically, the oil climbed above the 100-day SMA and if the price run above $48.55 will hit the 200-day SMA which is moving near $50.25. The Relative Strength Index (RSI) is holding in the positive territory but is flattening. In addition, the MACD oscillator created a bullish crossover with its trigger line and is moving with strong momentum above its neutral level.
Technically, the oil climbed above the 100-day SMA and if the price run above $48.55 will hit the 200-day SMA which is moving near $50.25. The Relative Strength Index (RSI) is holding in the positive territory but is flattening. In addition, the MACD oscillator created a bullish crossover with its trigger line and is moving with strong momentum above its neutral level.
This member did not declare if he had a position on this financial instrument or a related financial instrument.
About author

Offline


Add a comment
Comments
0 comments on the analysis WTI CRUDE OIL - Daily