WTI CRUDE OIL - WTI Crude Oil Fell Aggressively and Is Moving Towards $49.65 - 10/05/2017 (GMT)
- Who voted?
- 680
- 0
- Timeframe : Daily

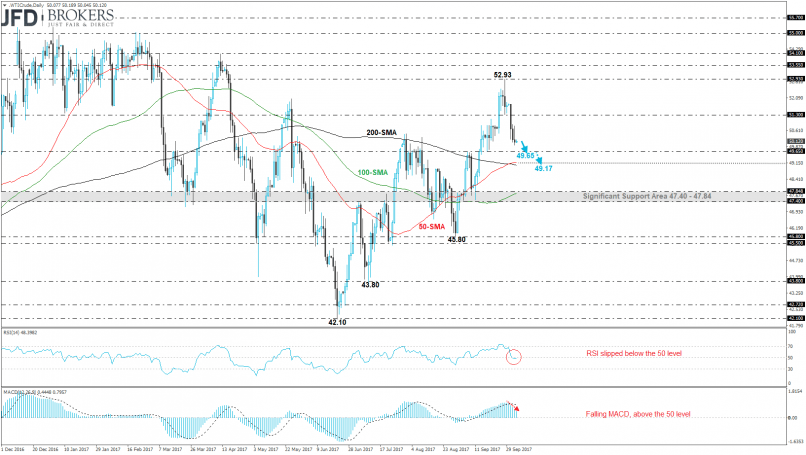
WTI CRUDE OIL Chart
Are you looking for opportunities in indices and forex?
DISCOVER LONDINIA OPPORTUNITIES...
DISCOVER LONDINIA OPPORTUNITIES...
The West Texas Intermediate crude oil has a sharp sell-off over the las three days and plunged more than 3% snapping the four winning weekly sessions. The price now is approaching the 50-week SMA, which coincides with the $49.65 strong support barrier and a penetration below the latter level will open the way for the 50-day SMA, $49.17.
From the technical point of view, on the short-term timeframe, the technical indicators are endorsing the scenario for more bearish movement. The RSI indicator slipped below the 50 level after the pullback on the overbought area and the MACD oscillator is falling in the positive territory. Also, MACD slipped below the trigger line signalling for the end of the upward tendency.
From the technical point of view, on the short-term timeframe, the technical indicators are endorsing the scenario for more bearish movement. The RSI indicator slipped below the 50 level after the pullback on the overbought area and the MACD oscillator is falling in the positive territory. Also, MACD slipped below the trigger line signalling for the end of the upward tendency.
This member declared not having a position on this financial instrument or a related financial instrument.
About author

Offline


Add a comment
Comments
0 comments on the analysis WTI CRUDE OIL - Daily