WTI CRUDE OIL - Extended Its Gains Sharply and Printed a More Than 2 -Year High at $56.39 - 11/06/2017 (GMT)
- Who voted?
- 637
- 0
- Timeframe : Daily
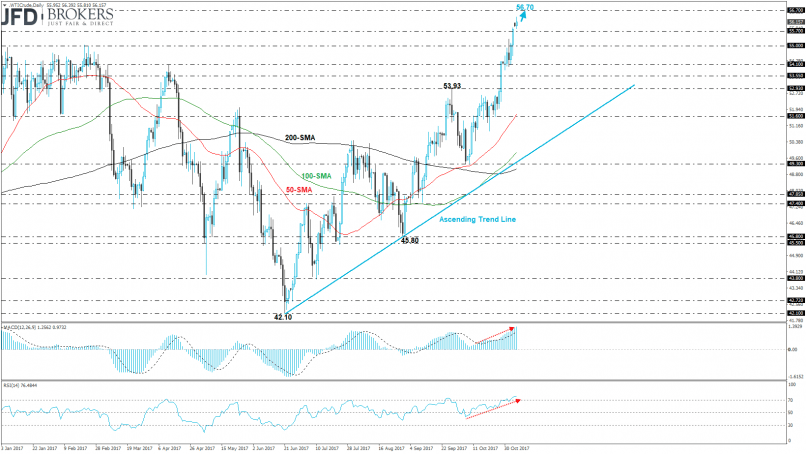
WTI CRUDE OIL Chart
Are you looking for opportunities in indices and forex?
DISCOVER LONDINIA OPPORTUNITIES...
DISCOVER LONDINIA OPPORTUNITIES...
The West Texas Intermediate crude oil created two bullish months in a row, adding more than 16% to its performance. The aggressive upward run recorded a new more than two-year high at $56.39 and the next level to focus on is the $56.70 resistance level. The oil rebounded on the $42.10 support level and started an ascending tendency that is holding until now.
The technical indicators, on the short-term timeframe, are moving sharply higher. The MACD oscillator is rising above the trigger and zero lines, whilst the RSI indicator jumped above the 70 level and lies in the overbought zone.
The technical indicators, on the short-term timeframe, are moving sharply higher. The MACD oscillator is rising above the trigger and zero lines, whilst the RSI indicator jumped above the 70 level and lies in the overbought zone.
This member declared not having a position on this financial instrument or a related financial instrument.
About author

Offline


Add a comment
Comments
0 comments on the analysis WTI CRUDE OIL - Daily