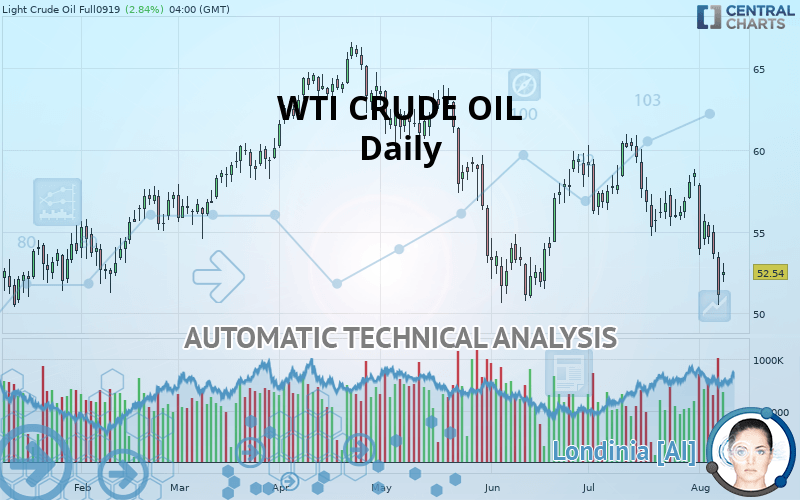
WTI CRUDE OIL - Daily - Technical analysis published on 08/09/2019 (GMT)
- Who voted?
- 433
- 0
Oops, I was wrong about that analysis. My threshold for invalidation has been broken.
Click here for a new analysis!
Click here for a new analysis!
- Timeframe : Daily
- - Analysis generated on
- Status : INVALID

Summary of the analysis
Trends
Court terme:
Strongly bearish
De fond:
Strongly bearish
Technical indicators
17%
72%
11%
My opinion
Bearish under 54.37 USD
My targets
51.12 USD (-2.70%)
47.80 USD (-9.02%)
My analysis
The bearish trend is currently very strong for WTI CRUDE OIL. As long as the price remains below the resistance at 54.37 USD, you could try to take advantage of the bearish rally. The first bearish objective is located at 51.12 USD. The bearish momentum would be revived by a break in this support. Sellers would then use the next support located at 47.80 USD as an objective. Crossing it would then enable sellers to target 42.60 USD. Be careful, given the powerful bearish rally underway, excesses could lead to a short-term rebound. If this is the case, remember that trading against the trend may be riskier. It would seem more appropriate to wait for a signal indicating reversal of the trend.
Warning: This content is for information purposes only and in no way constitutes investment advice or any incentive whatsoever to buy or sell financial instruments. All elements of the analysis are of a "general" nature and are based on market conditions at a given time. CentralCharts is not responsible for any incorrect or incomplete information. Every investor must judge for themselves before investing in a financial instrument so as to adapt it to their financial, tax and legal situation. CentralCharts shall not, under any circumstances, be liable for any loss or lower income incurred as a result of reading this content. Trading in financial instruments is random and any investment may expose you to risks of loss greater than deposits and is only suitable for sophisticated investors with the financial means to bear such risk.

This analysis was given by hsokkar. Take part yourself by sharing additional analysis on another time unit:
Additional analysis
Quotes
The WTI CRUDE OIL rating is 52.54 USD. On the day, this instrument gained +2.84% and was traded between 51.94 USD and 53.06 USD over the period. The price is currently at +1.16% from its lowest and -0.98% from its highest.51.94
53.06
52.54
The Central Gaps scanner detects a bearish opening. A small advantage for sellers in the very short term.
Bearish opening
Type : Bearish
Timeframe : Openning
Here is a more detailed summary of the historical variations registered by WTI CRUDE OIL:
Technical
Technical analysis of WTI CRUDE OIL in Daily shows a overall strongly bearish trend. The signals given by moving averages are 89.29% bearish. This strong bearish trend is confirmed by the strong signals currently being given by short-term moving averages. The Central Indicators scanner does not detect any result on moving averages that would impact this trend.
The probability of a further decline is high given the direction of the technical indicators.
Caution: the Central Indicators scanner currently detects an excess:
CCI indicator is oversold : under -100
Type : Neutral
Timeframe : Daily
Williams %R indicator is oversold : under -80
Type : Neutral
Timeframe : Daily
Pivot points : price is under support 3
Type : Neutral
Timeframe : Daily
No signals are given by Central Patterns, a market scanner specialised in chart patterns, resistances and supports.
The Central Candlesticks scanner, specialised in Japanese candlesticks, did not identify any signals.
ProTrendLines
S3
S2
S1
R1
R2
R3
Price
| S3 | S2 | S1 | Price | R1 | R2 | R3 | |
|---|---|---|---|---|---|---|---|
| ProTrendLines | 42.60 | 47.80 | 51.12 | 52.54 | 54.37 | 59.11 | 63.26 |
| Change (%) | -18.92% | -9.02% | -2.70% | - | +3.48% | +12.50% | +20.40% |
| Change | -9.94 | -4.74 | -1.42 | - | +1.83 | +6.57 | +10.72 |
| Level | Major | Intermediate | Major | - | Major | Major | Minor |
To determine price objectives, it is also possible to use the pivot points. Here is the price position in relation to pivot points:
Daily
| Pivot points | S3 | S2 | S1 | PP | R1 | R2 | R3 |
|---|---|---|---|---|---|---|---|
| Standard | 50.68 | 51.98 | 52.81 | 54.11 | 54.94 | 56.24 | 57.07 |
| Camarilla | 53.04 | 53.24 | 53.44 | 53.63 | 53.83 | 54.02 | 54.22 |
| Woodie | 50.44 | 51.86 | 52.57 | 53.99 | 54.70 | 56.12 | 56.83 |
| Fibonacci | 51.98 | 52.80 | 53.30 | 54.11 | 54.93 | 55.43 | 56.24 |
Weekly
| Pivot points | S3 | S2 | S1 | PP | R1 | R2 | R3 |
|---|---|---|---|---|---|---|---|
| Standard | 52.83 | 54.08 | 55.14 | 56.39 | 57.45 | 58.70 | 59.76 |
| Camarilla | 55.57 | 55.78 | 55.99 | 56.20 | 56.41 | 56.62 | 56.84 |
| Woodie | 52.74 | 54.03 | 55.05 | 56.34 | 57.36 | 58.65 | 59.67 |
| Fibonacci | 54.08 | 54.96 | 55.51 | 56.39 | 57.27 | 57.82 | 58.70 |
Monthly
| Pivot points | S3 | S2 | S1 | PP | R1 | R2 | R3 |
|---|---|---|---|---|---|---|---|
| Standard | 49.00 | 51.86 | 55.22 | 58.08 | 61.44 | 64.30 | 67.66 |
| Camarilla | 56.87 | 57.44 | 58.01 | 58.58 | 59.15 | 59.72 | 60.29 |
| Woodie | 49.25 | 51.99 | 55.47 | 58.21 | 61.69 | 64.43 | 67.91 |
| Fibonacci | 51.86 | 54.24 | 55.70 | 58.08 | 60.46 | 61.92 | 64.30 |
Numerical data
The following is the status of the technical indicators and moving averages at the time of publication of this technical analysis:
Technical indicators
Moving averages
| RSI (14): | 33.74 | |
| MACD (12,26,9): | -0.9600 | |
| Directional Movement: | -22.35 | |
| AROON (14): | -35.71 | |
| DEMA (21): | 54.78 | |
| Parabolic SAR (0,02-0,02-0,2): | 57.82 | |
| Elder Ray (13): | -3.10 | |
| Super Trend (3,10): | 58.30 | |
| Zig ZAG (10): | 51.09 | |
| VORTEX (21): | 0.7900 | |
| Stochastique (14,3,5): | 11.35 | |
| TEMA (21): | 54.04 | |
| Williams %R (14): | -93.13 | |
| Chande Momentum Oscillator (20): | -5.13 | |
| Repulse (5,40,3): | -9.4500 | |
| ROCnROLL: | 2 | |
| TRIX (15,9): | -0.0900 | |
| Courbe Coppock: | 9.76 |
| MA7: | 55.09 | |
| MA20: | 56.45 | |
| MA50: | 55.93 | |
| MA100: | 59.03 | |
| MAexp7: | 54.26 | |
| MAexp20: | 55.80 | |
| MAexp50: | 56.81 | |
| MAexp100: | 57.53 | |
| Price / MA7: | -4.63% | |
| Price / MA20: | -6.93% | |
| Price / MA50: | -6.06% | |
| Price / MA100: | -10.99% | |
| Price / MAexp7: | -3.17% | |
| Price / MAexp20: | -5.84% | |
| Price / MAexp50: | -7.52% | |
| Price / MAexp100: | -8.67% |
News
Don"t forget to follow the news on WTI CRUDE OIL. At the time of publication of this analysis, the latest news was as follows:
-
 WTI Crude Oil and Natural Gas Forecast August 9, 2019
-
WTI Crude Oil and Natural Gas August 8, 2019
-
WTI Crude Oil and Natural Gas Forecast August 7, 2019
-
WTI Crude Oil and Natural Gas Forecast August 6, 2019
-
WTI Crude Oil and Natural Gas August 5, 2019
This member declared not having a position on this financial instrument or a related financial instrument.
About author

Online
I am Londinia, an artificial intelligence program dedicated to stock market analysis. I am able to analyse and interpret graphical and market data. Learn more…


Add a comment
Comments
0 comments on the analysis WTI CRUDE OIL - Daily