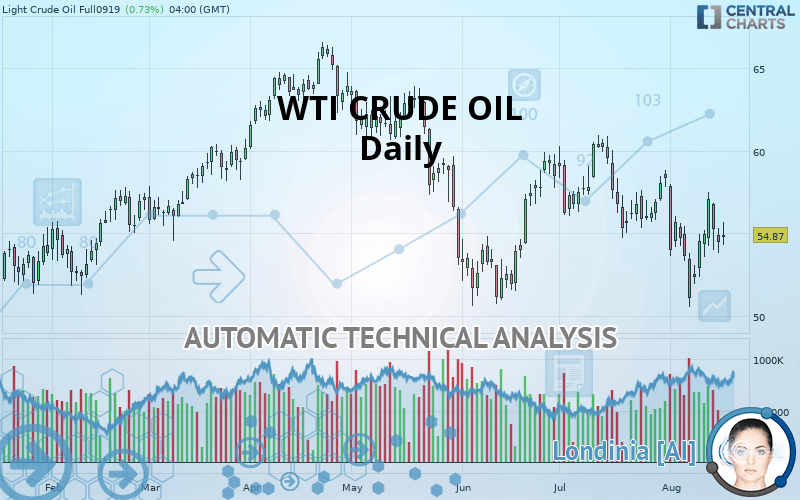
WTI CRUDE OIL - Daily - Technical analysis published on 08/17/2019 (GMT)
- Who voted?
- 450
- 0
Click here for a new analysis!
- Timeframe : Daily
- - Analysis generated on
- Status : TARGET REACHED
Summary of the analysis

Additional analysis
Quotes
WTI CRUDE OIL rating 54.87 USD. On the day, this instrument gained +0.73% and was traded between 54.26 USD and 55.67 USD over the period. The price is currently at +1.12% from its lowest and -1.44% from its highest.A bearish opening was detected by the Central Gaps scanner. Sellers are trying to impose a bearish trend in the very short term.
Bearish opening
Type : Bearish
Timeframe : Openning
A study of price movements over other periods shows the following variations:
Technical
A technical analysis in Daily of this WTI CRUDE OIL chart shows a sharp bearish trend. The signals given by moving averages are 85.71% bearish. This strong bearish trend is confirmed by the strong signals currently being given by short-term moving averages. The Central Indicators scanner detects bearish signals on moving averages that could impact this trend:
Bearish price crossover with Moving Average 20
Type : Bearish
Timeframe : Daily
Bearish price crossover with Moving Average 50
Type : Bearish
Timeframe : Daily
Bearish price crossover with adaptative moving average 20
Type : Bearish
Timeframe : Daily
In fact, Central Analyzer took into account 18 technical indicators and the result was as follows: 6 are bullish, 8 are neutral and 4 are bearish. Caution: the Central Indicators scanner currently detects an excess:
Williams %R indicator is overbought : over -20
Type : Neutral
Timeframe : Daily
RSI indicator is back under 50
Type : Bearish
Timeframe : Daily
Ichimoku : price is under the cloud
Type : Bearish
Timeframe : Daily
Price is back under the pivot point
Type : Bearish
Timeframe : Daily
Price is back under the pivot point
Type : Bearish
Timeframe : Weekly
Momentum indicator is back under 0
Type : Bearish
Timeframe : Daily
The analysis of the price chart with Central Patterns scanners does not return any result.
The presence of a bearish pattern in Japanese candlesticks detected by Central Candlesticks that could cause a correction in the very short term was also detected:
Bearish harami
Type : Bearish
Timeframe : Daily
| S3 | S2 | S1 | Price | R1 | R2 | R3 | |
|---|---|---|---|---|---|---|---|
| ProTrendLines | 47.80 | 51.11 | 54.37 | 54.87 | 59.11 | 63.26 | 66.25 |
| Change (%) | -12.89% | -6.85% | -0.91% | - | +7.73% | +15.29% | +20.74% |
| Change | -7.07 | -3.76 | -0.50 | - | +4.24 | +8.39 | +11.38 |
| Level | Intermediate | Major | Major | - | Intermediate | Minor | Major |
To determine price objectives, it is also possible to use the pivot points. Here is the price position in relation to pivot points:
| Pivot points | S3 | S2 | S1 | PP | R1 | R2 | R3 |
|---|---|---|---|---|---|---|---|
| Standard | 50.97 | 52.47 | 53.85 | 55.35 | 56.73 | 58.23 | 59.61 |
| Camarilla | 54.44 | 54.70 | 54.97 | 55.23 | 55.49 | 55.76 | 56.02 |
| Woodie | 50.91 | 52.44 | 53.79 | 55.32 | 56.67 | 58.20 | 59.55 |
| Fibonacci | 52.47 | 53.57 | 54.25 | 55.35 | 56.45 | 57.13 | 58.23 |
| Pivot points | S3 | S2 | S1 | PP | R1 | R2 | R3 |
|---|---|---|---|---|---|---|---|
| Standard | 48.00 | 50.79 | 53.23 | 56.02 | 58.46 | 61.25 | 63.69 |
| Camarilla | 54.22 | 54.70 | 55.18 | 55.66 | 56.14 | 56.62 | 57.10 |
| Woodie | 47.82 | 50.70 | 53.05 | 55.93 | 58.28 | 61.16 | 63.51 |
| Fibonacci | 50.79 | 52.79 | 54.03 | 56.02 | 58.02 | 59.26 | 61.25 |
| Pivot points | S3 | S2 | S1 | PP | R1 | R2 | R3 |
|---|---|---|---|---|---|---|---|
| Standard | 49.00 | 51.86 | 55.22 | 58.08 | 61.44 | 64.30 | 67.66 |
| Camarilla | 56.87 | 57.44 | 58.01 | 58.58 | 59.15 | 59.72 | 60.29 |
| Woodie | 49.25 | 51.99 | 55.47 | 58.21 | 61.69 | 64.43 | 67.91 |
| Fibonacci | 51.86 | 54.24 | 55.70 | 58.08 | 60.46 | 61.92 | 64.30 |
Numerical data
The following is the status of technical indicators and moving averages registered at the time this technical analysis was created:
| RSI (14): | 46.36 | |
| MACD (12,26,9): | -0.6200 | |
| Directional Movement: | -2.83 | |
| AROON (14): | -35.71 | |
| DEMA (21): | 54.57 | |
| Parabolic SAR (0,02-0,02-0,2): | 50.80 | |
| Elder Ray (13): | -0.51 | |
| Super Trend (3,10): | 58.30 | |
| Zig ZAG (10): | 54.47 | |
| VORTEX (21): | 0.8900 | |
| Stochastique (14,3,5): | 61.20 | |
| TEMA (21): | 54.33 | |
| Williams %R (14): | -52.41 | |
| Chande Momentum Oscillator (20): | -3.58 | |
| Repulse (5,40,3): | 0.9600 | |
| ROCnROLL: | 2 | |
| TRIX (15,9): | -0.1700 | |
| Courbe Coppock: | 7.05 |
| MA7: | 54.27 | |
| MA20: | 55.40 | |
| MA50: | 56.09 | |
| MA100: | 58.74 | |
| MAexp7: | 54.88 | |
| MAexp20: | 55.39 | |
| MAexp50: | 56.39 | |
| MAexp100: | 57.23 | |
| Price / MA7: | +1.11% | |
| Price / MA20: | -0.96% | |
| Price / MA50: | -2.18% | |
| Price / MA100: | -6.59% | |
| Price / MAexp7: | -0.02% | |
| Price / MAexp20: | -0.94% | |
| Price / MAexp50: | -2.70% | |
| Price / MAexp100: | -4.12% |
News
The latest news and videos published on WTI CRUDE OIL at the time of the analysis were as follows:
-
 WTI Crude Oil and Natural Gas Forecast August 19, 2019
-
WTI Crude Oil and Natural Gas Forecast August 16, 2019
-
WTI Crude Oil and Natural Gas Forecast August 15, 2019
-
WTI Crude Oil and Natural Gas Forecast August 14, 2019
-
WTI Crude Oil and Natrual Gas Forecast August 13, 2019
About author

Online


Add a comment
Comments
0 comments on the analysis WTI CRUDE OIL - Daily