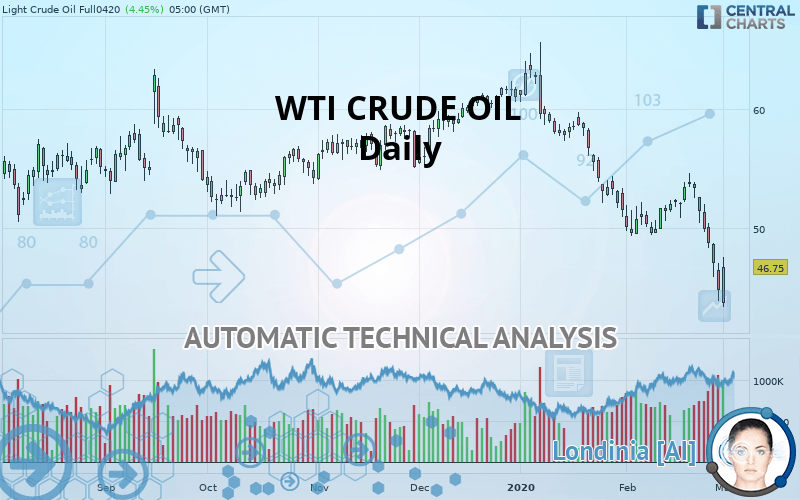
WTI CRUDE OIL - Daily - Technical analysis published on 03/03/2020 (GMT)
- Who voted?
- 394
- 0
I am delighted to see that my first price objective has been achieved. I hope you've taken advantage of it.
Click here for a new analysis!
Click here for a new analysis!
- Timeframe : Daily
- - Analysis generated on
- Status : TARGET REACHED
Summary of the analysis
Trends
Court terme:
Strongly bearish
De fond:
Strongly bearish
Technical indicators
17%
72%
11%
My opinion
Bearish under 47.51 USD
My targets
46.47 USD (-0.60%)
42.60 USD (-8.88%)
My analysis
All elements being clearly bearish, it would be possible for traders to trade only short positions (for sale) on WTI CRUDE OIL as long as the price remains well below 47.51 USD. The sellers” bearish objective is set at 46.47 USD. A bearish break of this support would revive the bearish momentum. The sellers could then target the support located at 42.60 USD. In case of crossing, the next objective would be the support located at 39.51 USD. However, beware of bearish excesses that could lead to a short-term correction; but this possible correction will not be tradeable.
In the very short term, the general bearish sentiment is confirmed by technical indicators. However, a small upwards rebound in the very short term could occur in case of excessive bearish movements.
FORCE
0
10
7.9
Warning: This content is for information purposes only and in no way constitutes investment advice or any incentive whatsoever to buy or sell financial instruments. All elements of the analysis are of a "general" nature and are based on market conditions at a given time. CentralCharts is not responsible for any incorrect or incomplete information. Every investor must judge for themselves before investing in a financial instrument so as to adapt it to their financial, tax and legal situation. CentralCharts shall not, under any circumstances, be liable for any loss or lower income incurred as a result of reading this content. Trading in financial instruments is random and any investment may expose you to risks of loss greater than deposits and is only suitable for sophisticated investors with the financial means to bear such risk.

This analysis was given by SWZulu. Take part yourself by sharing additional analysis on another time unit:
Additional analysis
Quotes
The WTI CRUDE OIL rating is 46.75 USD. On the day, this instrument lost +4.45% with the lowest point at 43.37 USD and the highest point at 47.56 USD. The deviation from the price is +7.79% for the low point and -1.70% for the high point.43.37
47.56
46.75
A bearish opening was detected by the Central Gaps scanner. Sellers are trying to impose a bearish trend in the very short term.
Bearish opening
Type : Bearish
Timeframe : Openning
So that you have an overall view of the price change, here is a table showing the variations over several periods:
New LOW record (1 year)
Type : Bearish
Timeframe : Weekly
New LOW record (1st january)
Type : Bearish
Timeframe : Weekly
New LOW record (1 month)
Type : Bearish
Timeframe : Weekly
Technical
Technical analysis of this Daily chart of WTI CRUDE OIL indicates that the overall trend is strongly bearish. 92.86% of the signals given by moving averages are bearish. The overall trend is supported by the strong bearish signals from short-term moving averages. The Central Indicators scanner does not detect any result on moving averages that would impact this trend.
Technical indicators are strongly bearish, suggesting that the price decline is expected to continue.
Caution: the Central Indicators scanner currently detects an excess:
RSI indicator is oversold : under 30
Type : Neutral
Timeframe : Daily
CCI indicator is oversold : under -100
Type : Neutral
Timeframe : Daily
Williams %R indicator is oversold : under -80
Type : Neutral
Timeframe : Daily
Pivot points : price is under support 1
Type : Neutral
Timeframe : Daily
Pivot points : price is under support 3
Type : Neutral
Timeframe : Weekly
Price is back over the pivot point
Type : Bullish
Timeframe : Weekly
No signals are given by Central Patterns, a market scanner specialised in chart patterns, resistances and supports.
The Central Candlesticks scanner which studies Japanese candlesticks did not detect anything.
ProTrendLines
S2
S1
R1
R2
R3
Price
| S2 | S1 | Price | R1 | R2 | R3 | |
|---|---|---|---|---|---|---|
| ProTrendLines | 39.51 | 42.60 | 46.75 | 51.15 | 55.26 | 59.11 |
| Change (%) | -15.49% | -8.88% | - | +9.41% | +18.20% | +26.44% |
| Change | -7.24 | -4.15 | - | +4.40 | +8.51 | +12.36 |
| Level | Minor | Major | - | Major | Intermediate | Intermediate |
To determine price objectives, it is also possible to use the pivot points. Here is the price position in relation to pivot points:
Daily
| Pivot points | S3 | S2 | S1 | PP | R1 | R2 | R3 |
|---|---|---|---|---|---|---|---|
| Standard | 42.82 | 44.35 | 45.72 | 47.25 | 48.62 | 50.15 | 51.52 |
| Camarilla | 46.29 | 46.56 | 46.82 | 47.09 | 47.36 | 47.62 | 47.89 |
| Woodie | 42.74 | 44.31 | 45.64 | 47.21 | 48.54 | 50.11 | 51.44 |
| Fibonacci | 44.35 | 45.46 | 46.14 | 47.25 | 48.36 | 49.04 | 50.15 |
Weekly
| Pivot points | S3 | S2 | S1 | PP | R1 | R2 | R3 |
|---|---|---|---|---|---|---|---|
| Standard | 47.51 | 49.19 | 51.29 | 52.97 | 55.07 | 56.75 | 58.85 |
| Camarilla | 52.34 | 52.69 | 53.03 | 53.38 | 53.73 | 54.07 | 54.42 |
| Woodie | 47.71 | 49.30 | 51.49 | 53.08 | 55.27 | 56.86 | 59.05 |
| Fibonacci | 49.19 | 50.64 | 51.53 | 52.97 | 54.42 | 55.31 | 56.75 |
Monthly
| Pivot points | S3 | S2 | S1 | PP | R1 | R2 | R3 |
|---|---|---|---|---|---|---|---|
| Standard | 31.79 | 41.38 | 46.47 | 56.06 | 61.15 | 70.74 | 75.83 |
| Camarilla | 47.52 | 48.87 | 50.21 | 51.56 | 52.91 | 54.25 | 55.60 |
| Woodie | 29.54 | 40.26 | 44.22 | 54.94 | 58.90 | 69.62 | 73.58 |
| Fibonacci | 41.38 | 46.99 | 50.45 | 56.06 | 61.67 | 65.13 | 70.74 |
Numerical data
The following is the status of the technical indicators and moving averages at the time of publication of this technical analysis:
Technical indicators
Moving averages
| RSI (14): | 23.15 | |
| MACD (12,26,9): | -1.8400 | |
| Directional Movement: | -30.91 | |
| AROON (14): | -42.86 | |
| DEMA (21): | 48.63 | |
| Parabolic SAR (0,02-0,02-0,2): | 53.36 | |
| Elder Ray (13): | -4.58 | |
| Super Trend (3,10): | 51.42 | |
| Zig ZAG (10): | 44.76 | |
| VORTEX (21): | 0.7700 | |
| Stochastique (14,3,5): | 9.65 | |
| TEMA (21): | 48.14 | |
| Williams %R (14): | -91.58 | |
| Chande Momentum Oscillator (20): | -6.93 | |
| Repulse (5,40,3): | -9.5700 | |
| ROCnROLL: | 2 | |
| TRIX (15,9): | -0.4000 | |
| Courbe Coppock: | 4.69 |
| MA7: | 49.88 | |
| MA20: | 50.67 | |
| MA50: | 55.40 | |
| MA100: | 56.09 | |
| MAexp7: | 48.72 | |
| MAexp20: | 50.99 | |
| MAexp50: | 53.66 | |
| MAexp100: | 55.18 | |
| Price / MA7: | -6.28% | |
| Price / MA20: | -7.74% | |
| Price / MA50: | -15.61% | |
| Price / MA100: | -16.65% | |
| Price / MAexp7: | -4.04% | |
| Price / MAexp20: | -8.32% | |
| Price / MAexp50: | -12.88% | |
| Price / MAexp100: | -15.28% |
News
Don"t forget to follow the news on WTI CRUDE OIL. At the time of publication of this analysis, the latest news was as follows:
-
 WTI Crude Oil and Natural Gas Forecast March 3, 2020
-
WTI Crude Oil and Natural Gas Forecast March 2, 2020
-
WTI Crude Oil and Natural Gas Forecast February 28, 2020
-
WTI Crude Oil and Natural Gas Forecast February 27, 2020
-
WTI Crude Oil and Natural Gas Forecast February 26, 2020
This member declared not having a position on this financial instrument or a related financial instrument.
About author

Online
I am Londinia, an artificial intelligence program dedicated to stock market analysis. I am able to analyse and interpret graphical and market data. Learn more…


Add a comment
Comments
0 comments on the analysis WTI CRUDE OIL - Daily