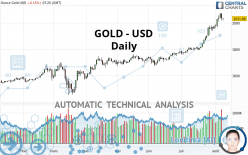
GOLD - USD - Daily - Technical analysis published on 08/10/2020 (GMT)
- 122
- 0
Click here for a new analysis!
- Timeframe : Daily
- - Analysis generated on
- Status : INVALID

Summary of the analysis

Additional analysis
Quotes
GOLD - USD rating 2,031.88 USD. The price registered a decrease of -0.15% on the session and was between 2,019.24 USD and 2,036.46 USD. This implies that the price is at +0.63% from its lowest and at -0.22% from its highest.The Central Gaps scanner detects a bearish opening. A small advantage for sellers in the very short term.
Bearish opening
Type : Bearish
Timeframe : Openning
So that you have an overall view of the price change, here is a table showing the variations over several periods:
Near a new HIGH record (5 years)
Type : Bullish
Timeframe : Weekly
Near a new HIGH record (1st january)
Type : Bullish
Timeframe : Weekly
Near a new HIGH record (1 month)
Type : Bullish
Timeframe : Weekly
Technical
A technical analysis in Daily of this GOLD - USD chart shows a strongly bullish trend. 92.86% of the signals given by moving averages are bullish. The overall trend is supported by the strong bullish signals from short-term moving averages. There is no crossing of moving average by the price or crossing of moving averages between themselves.
Technical indicators are strongly bullish, suggesting that the price increase should continue.
But beware of excesses. The Central Indicators scanner currently detects this:
RSI indicator is overbought : over 70
Type : Neutral
Timeframe : Daily
CCI indicator is overbought : over 100
Type : Neutral
Timeframe : Daily
CCI indicator: bearish divergence
Type : Bearish
Timeframe : Daily
MACD indicator: bearish divergence
Type : Bearish
Timeframe : Daily
RSI indicator: bearish divergence
Type : Bearish
Timeframe : Daily
Williams %R indicator is overbought : over -20
Type : Neutral
Timeframe : Daily
Price is back over the pivot point
Type : Bullish
Timeframe : Weekly
Price is back under the pivot point
Type : Bearish
Timeframe : Daily
Central Patterns, the scanner specializing in chart patterns, did not identify any signals.
No result was found by the Central Candlesticks scanner on Japanese candlesticks.
| S3 | S2 | S1 | Price | |
|---|---|---|---|---|
| ProTrendLines | 1,683.93 | 1,809.27 | 1,909.60 | 2,031.88 |
| Change (%) | -17.12% | -10.96% | -6.02% | - |
| Change | -347.95 | -222.61 | -122.28 | - |
| Level | Major | Intermediate | Intermediate | - |
Attention could also be paid to pivot points to set price objectives:
| Pivot points | S3 | S2 | S1 | PP | R1 | R2 | R3 |
|---|---|---|---|---|---|---|---|
| Standard | 1,951.96 | 1,983.74 | 2,009.32 | 2,041.10 | 2,066.68 | 2,098.46 | 2,124.04 |
| Camarilla | 2,019.13 | 2,024.38 | 2,029.64 | 2,034.90 | 2,040.16 | 2,045.42 | 2,050.67 |
| Woodie | 1,948.86 | 1,982.19 | 2,006.22 | 2,039.55 | 2,063.58 | 2,096.91 | 2,120.94 |
| Fibonacci | 1,983.74 | 2,005.65 | 2,019.19 | 2,041.10 | 2,063.01 | 2,076.55 | 2,098.46 |
| Pivot points | S3 | S2 | S1 | PP | R1 | R2 | R3 |
|---|---|---|---|---|---|---|---|
| Standard | 1,857.50 | 1,909.07 | 1,971.98 | 2,023.55 | 2,086.46 | 2,138.03 | 2,200.94 |
| Camarilla | 2,003.42 | 2,013.91 | 2,024.41 | 2,034.90 | 2,045.39 | 2,055.89 | 2,066.38 |
| Woodie | 1,863.18 | 1,911.91 | 1,977.66 | 2,026.39 | 2,092.14 | 2,140.87 | 2,206.62 |
| Fibonacci | 1,909.07 | 1,952.80 | 1,979.82 | 2,023.55 | 2,067.28 | 2,094.30 | 2,138.03 |
| Pivot points | S3 | S2 | S1 | PP | R1 | R2 | R3 |
|---|---|---|---|---|---|---|---|
| Standard | 1,600.87 | 1,679.23 | 1,827.40 | 1,905.76 | 2,053.93 | 2,132.29 | 2,280.46 |
| Camarilla | 1,913.27 | 1,934.04 | 1,954.81 | 1,975.57 | 1,996.34 | 2,017.10 | 2,037.87 |
| Woodie | 1,635.78 | 1,696.68 | 1,862.31 | 1,923.21 | 2,088.84 | 2,149.74 | 2,315.37 |
| Fibonacci | 1,679.23 | 1,765.76 | 1,819.23 | 1,905.76 | 1,992.29 | 2,045.76 | 2,132.29 |
Numerical data
The following are the details of the technical indicators and moving averages that were collected to generate this technical analysis:
| RSI (14): | 75.26 | |
| MACD (12,26,9): | 66.8200 | |
| Directional Movement: | 29.22 | |
| AROON (14): | 85.71 | |
| DEMA (21): | 2,030.42 | |
| Parabolic SAR (0,02-0,02-0,2): | 2,004.16 | |
| Elder Ray (13): | 45.44 | |
| Super Trend (3,10): | 1,945.08 | |
| Zig ZAG (10): | 2,031.49 | |
| VORTEX (21): | 1.3100 | |
| Stochastique (14,3,5): | 87.79 | |
| TEMA (21): | 2,060.38 | |
| Williams %R (14): | -18.86 | |
| Chande Momentum Oscillator (20): | 146.07 | |
| Repulse (5,40,3): | 1.0700 | |
| ROCnROLL: | 1 | |
| TRIX (15,9): | 0.4600 | |
| Courbe Coppock: | 20.55 |
| MA7: | 2,022.27 | |
| MA20: | 1,927.34 | |
| MA50: | 1,822.31 | |
| MA100: | 1,756.12 | |
| MAexp7: | 2,018.61 | |
| MAexp20: | 1,946.26 | |
| MAexp50: | 1,854.52 | |
| MAexp100: | 1,775.88 | |
| Price / MA7: | +0.48% | |
| Price / MA20: | +5.42% | |
| Price / MA50: | +11.50% | |
| Price / MA100: | +15.70% | |
| Price / MAexp7: | +0.66% | |
| Price / MAexp20: | +4.40% | |
| Price / MAexp50: | +9.56% | |
| Price / MAexp100: | +14.42% |
News
The latest news and videos published on GOLD - USD at the time of the analysis were as follows:
-
 Dollar, S&P 500, Gold - The Potential for Trend, Reversal or Congestion
-
Gold and Silver Forecast August 10, 2020
-
Gold Technical Analysis for the Week of August 10, 2020 by FXEmpire
-
Gold Technical Analysis for August 10, 2020 by FXEmpire
-
Gold and Silver Forecast August 7, 2020
About author

Online


Add a comment
Comments
0 comments on the analysis GOLD - USD - Daily