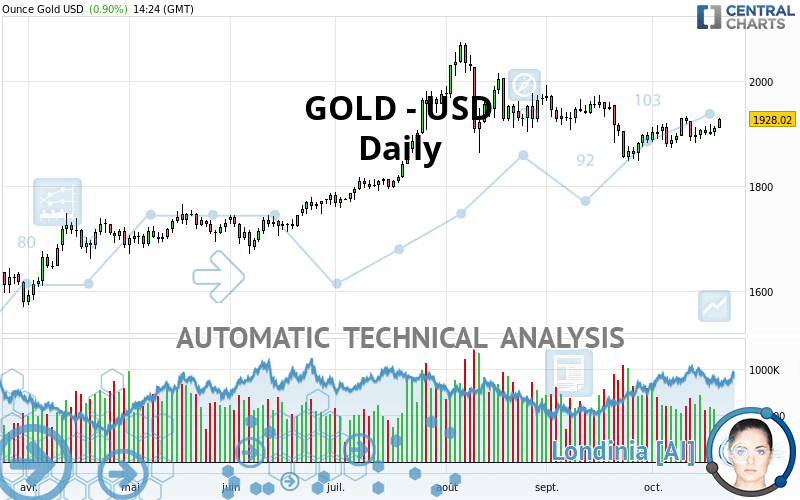
GOLD - USD - Daily - Technical analysis published on 10/21/2020 (GMT)
- 160
- 0
Click here for a new analysis!
- Timeframe : Daily
- - Analysis generated on
- Status : INVALID

Summary of the analysis

Additional analysis
Quotes
The GOLD - USD price is 1,928.07 USD. The price registered an increase of +0.91% on the session and was traded between 1,910.13 USD and 1,929.17 USD over the period. The price is currently at +0.94% from its lowest and -0.06% from its highest.A bullish opening was detected by the Central Gaps scanner. Buyers are trying to impose a bullish momentum in the very short term.
Bullish opening
Type : Bullish
Timeframe : Openning
A study of price movements over other periods shows the following variations:
Technical
A technical analysis in Daily of this GOLD - USD chart shows a strongly bullish trend. 89.29% of the signals given by moving averages are bullish. This strongly bullish trend is supported by the strong bullish signals given by short-term moving averages. An assessment of moving averages reveals several bullish signals that could impact this trend:
Bullish trend reversal : Moving Average 20
Type : Bullish
Timeframe : Daily
Bullish trend reversal : Moving Average 50
Type : Bullish
Timeframe : Daily
Bullish trend reversal : adaptative moving average 20
Type : Bullish
Timeframe : Daily
Bullish trend reversal : adaptative moving average 50
Type : Bullish
Timeframe : Daily
Bullish price crossover with Moving Average 50
Type : Bullish
Timeframe : Daily
In fact, 14 technical indicators on 18 studied are currently positioned bullish. But beware of excesses. The Central Indicators scanner currently detects this:
CCI indicator is overbought : over 100
Type : Neutral
Timeframe : Daily
Williams %R indicator is overbought : over -20
Type : Neutral
Timeframe : Daily
Pivot points : price is over resistance 2
Type : Neutral
Timeframe : Daily
Price is back under the pivot point
Type : Bearish
Timeframe : Weekly
No signals are given by Central Patterns, a market scanner specialised in chart patterns, resistances and supports.
The Central Candlesticks scanner which studies Japanese candlesticks did not detect anything.
| S3 | S2 | S1 | Price | R1 | R2 | R3 | |
|---|---|---|---|---|---|---|---|
| ProTrendLines | 1,683.93 | 1,792.46 | 1,909.60 | 1,928.07 | 1,959.93 | 2,005.39 | 2,069.41 |
| Change (%) | -12.66% | -7.03% | -0.96% | - | +1.65% | +4.01% | +7.33% |
| Change | -244.14 | -135.61 | -18.47 | - | +31.86 | +77.32 | +141.34 |
| Level | Major | Minor | Major | - | Intermediate | Minor | Major |
To determine price objectives, it is also possible to use the pivot points. Here is the price position in relation to pivot points:
| Pivot points | S3 | S2 | S1 | PP | R1 | R2 | R3 |
|---|---|---|---|---|---|---|---|
| Standard | 1,879.42 | 1,887.06 | 1,898.89 | 1,906.53 | 1,918.36 | 1,926.00 | 1,937.83 |
| Camarilla | 1,905.38 | 1,907.16 | 1,908.95 | 1,910.73 | 1,912.52 | 1,914.30 | 1,916.08 |
| Woodie | 1,881.53 | 1,888.11 | 1,901.00 | 1,907.58 | 1,920.47 | 1,927.05 | 1,939.94 |
| Fibonacci | 1,887.06 | 1,894.49 | 1,899.09 | 1,906.53 | 1,913.96 | 1,918.56 | 1,926.00 |
| Pivot points | S3 | S2 | S1 | PP | R1 | R2 | R3 |
|---|---|---|---|---|---|---|---|
| Standard | 1,826.92 | 1,854.69 | 1,877.82 | 1,905.59 | 1,928.72 | 1,956.49 | 1,979.62 |
| Camarilla | 1,886.95 | 1,891.62 | 1,896.28 | 1,900.95 | 1,905.62 | 1,910.28 | 1,914.95 |
| Woodie | 1,824.60 | 1,853.53 | 1,875.50 | 1,904.43 | 1,926.40 | 1,955.33 | 1,977.30 |
| Fibonacci | 1,854.69 | 1,874.13 | 1,886.15 | 1,905.59 | 1,925.03 | 1,937.05 | 1,956.49 |
| Pivot points | S3 | S2 | S1 | PP | R1 | R2 | R3 |
|---|---|---|---|---|---|---|---|
| Standard | 1,683.03 | 1,765.90 | 1,826.76 | 1,909.63 | 1,970.49 | 2,053.36 | 2,114.22 |
| Camarilla | 1,848.10 | 1,861.28 | 1,874.46 | 1,887.63 | 1,900.81 | 1,913.98 | 1,927.16 |
| Woodie | 1,672.04 | 1,760.40 | 1,815.77 | 1,904.13 | 1,959.50 | 2,047.86 | 2,103.23 |
| Fibonacci | 1,765.90 | 1,820.80 | 1,854.72 | 1,909.63 | 1,964.53 | 1,998.45 | 2,053.36 |
Numerical data
The following are the details of the technical indicators and moving averages that were collected to generate this technical analysis:
| RSI (14): | 55.10 | |
| MACD (12,26,9): | -1.8200 | |
| Directional Movement: | -0.35 | |
| AROON (14): | 21.43 | |
| DEMA (21): | 1,903.59 | |
| Parabolic SAR (0,02-0,02-0,2): | 1,883.27 | |
| Elder Ray (13): | 11.58 | |
| Super Trend (3,10): | 1,963.60 | |
| Zig ZAG (10): | 1,928.16 | |
| VORTEX (21): | 1.0300 | |
| Stochastique (14,3,5): | 68.19 | |
| TEMA (21): | 1,906.23 | |
| Williams %R (14): | -8.14 | |
| Chande Momentum Oscillator (20): | 15.18 | |
| Repulse (5,40,3): | 1.2400 | |
| ROCnROLL: | 1 | |
| TRIX (15,9): | -0.0500 | |
| Courbe Coppock: | 2.12 |
| MA7: | 1,905.51 | |
| MA20: | 1,898.53 | |
| MA50: | 1,925.47 | |
| MA100: | 1,877.91 | |
| MAexp7: | 1,910.15 | |
| MAexp20: | 1,908.21 | |
| MAexp50: | 1,907.35 | |
| MAexp100: | 1,868.76 | |
| Price / MA7: | +1.18% | |
| Price / MA20: | +1.56% | |
| Price / MA50: | +0.14% | |
| Price / MA100: | +2.67% | |
| Price / MAexp7: | +0.94% | |
| Price / MAexp20: | +1.04% | |
| Price / MAexp50: | +1.09% | |
| Price / MAexp100: | +3.17% |
News
Don"t forget to follow the news on GOLD - USD. At the time of publication of this analysis, the latest news was as follows:
-
 Gold and Silver Forecast October 21, 2020
-
DailyFX Education Summit | The Basics of Trading Oil and Gold
-
Gold Technical Analysis for October 21, 2020 by FXEmpire
-
Gold and Silver Forecast October 20, 2020
-
Gold Technical Analysis for October 20, 2020 by FXEmpire
About author

Online


Add a comment
Comments
0 comments on the analysis GOLD - USD - Daily