GOLD - USD - Gold still trading sideways - 09/30/2014 (GMT)
- 692
- 0
- Timeframe : 4H

GOLD - USD Chart
Are you looking for opportunities in indices and forex?
DISCOVER LONDINIA OPPORTUNITIES...
DISCOVER LONDINIA OPPORTUNITIES...
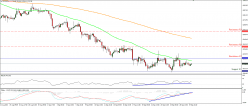
• Gold remains trapped in a range between the 1208 (S1) support area and the resistance of 1225 (R1). Since the precious metal seems to be oscillating between these two lines, a break in either direction is likely to determine the forthcoming near-term bias. On the daily chart the price structure still suggests a downtrend, but our daily momentum indicators give me an extra reason to remain flat. The 14-day RSI exited its oversold field and is now pointing up, while the daily MACD shows signs of topping and looks ready to cross below its signal line.
• Support: 1208 (S1), 1200 (S2), 1180 (S3)
• Resistance: 1225 (R1), 1240 (R2), 1260 (R3)
• Support: 1208 (S1), 1200 (S2), 1180 (S3)
• Resistance: 1225 (R1), 1240 (R2), 1260 (R3)
This member did not declare if he had a position on this financial instrument or a related financial instrument.
About author

Offline


Add a comment
Comments
0 comments on the analysis GOLD - USD - 4H