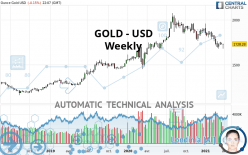
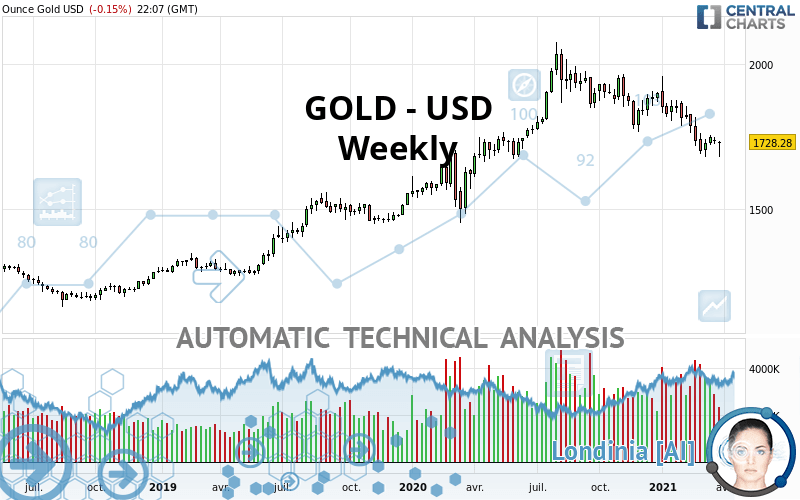
GOLD - USD - Weekly - Technical analysis published on 04/04/2021 (GMT)
- 175
- 0
Oops, I was wrong about that analysis. My threshold for invalidation has been broken.
Click here for a new analysis!
Click here for a new analysis!
- Timeframe : Weekly
- - Analysis generated on
- Status : INVALID
Summary of the analysis
Trends
Court terme:
Strongly bearish
De fond:
Neutral
Technical indicators
28%
56%
17%
My opinion
Bearish under 1,778.85 USD
My targets
1,682.00 USD (-2.68%)
1,545.47 USD (-10.58%)
My analysis
The current short-term bearish acceleration registered on GOLD - USD should quickly allow the basic trend to return to a bearish trend. To avoid contradicting the short term, traders could favour short positions (for sale) as long as the price remains well below 1,778.85 USD. Short-term sellers will use the support located at 1,682.00 USD as an objective. A bearish break of this support would revive the bearish momentum. The next bearish objective would then be set at 1,545.47 USD. Crossing this support would then open the door for sellers to target 1,471.86 USD. Caution, if there is a return to below 1,778.85 USD, it should not be forgotten that the basic trend is not yet clearly defined. Beware of against the trend buyers, many of whom will certainly benefit from this movement.
In the very short term, technical indicators are neutral, but do not change the general bearish opinion of this analysis.
Force
0
10
2.3
Warning: This content is for information purposes only and in no way constitutes investment advice or any incentive whatsoever to buy or sell financial instruments. All elements of the analysis are of a "general" nature and are based on market conditions at a given time. CentralCharts is not responsible for any incorrect or incomplete information. Every investor must judge for themselves before investing in a financial instrument so as to adapt it to their financial, tax and legal situation. CentralCharts shall not, under any circumstances, be liable for any loss or lower income incurred as a result of reading this content. Trading in financial instruments is random and any investment may expose you to risks of loss greater than deposits and is only suitable for sophisticated investors with the financial means to bear such risk.

This analysis was given by huthayfa. Take part yourself by sharing additional analysis on another time unit:
Additional analysis
Quotes
The GOLD - USD rating is 1,728.28 USD. The price registered a decrease of -0.27% over 5 days with the lowest point at 1,677.92 USD and the highest point at 1,732.33 USD. The deviation from the price is +3.00% for the low point and -0.23% for the high point.1,677.92
1,732.33
1,728.28
A bearish gap was detected at the opening by the Central Gaps scanner. There are a lot of sellers and they have the upper hand in the very short term.
Opening Gap DOWN
Type : Bearish
Timeframe : Openning
A study of price movements over other periods shows the following variations:
Near a new LOW record (1st january)
Type : Bearish
Timeframe : Weekly
Technical
A technical analysis in Weekly of this GOLD - USD chart shows a neutral trend. The trend could quickly turn bearish due to the strong bearish signals currently being given by short-term moving averages. The Central Indicators scanner does not detect any result on moving averages that would impact this trend.
The technical indicators are generally neutral. They do not provide relevant information on the direction of future price movements.
But beware of excesses. The Central Indicators scanner currently detects this:
CCI indicator is oversold : under -100
Type : Neutral
Timeframe : Weekly
MACD indicator: bullish divergence
Type : Bullish
Timeframe : Weekly
Williams %R indicator is oversold : under -80
Type : Neutral
Timeframe : Weekly
Pivot points : price is over resistance 1
Type : Neutral
Timeframe : Weekly
Pivot points : price is under support 3
Type : Neutral
Timeframe : Weekly
Central Patterns, the scanner specializing in chart patterns, did not identify any signals.
From the Japanese candlestick perspective, the Central Candlesticks scanner notes the presence of these results that could impact the short-term trend:
Bearish harami
Type : Bearish
Timeframe : Weekly
Doji
Type : Neutral
Timeframe : Weekly
ProTrendLines
S3
S2
S1
R1
R2
R3
Price
| S3 | S2 | S1 | Price | R1 | R2 | R3 | |
|---|---|---|---|---|---|---|---|
| ProTrendLines | 1,471.86 | 1,545.47 | 1,682.00 | 1,728.28 | 1,778.85 | 1,909.60 | 2,069.41 |
| Change (%) | -14.84% | -10.58% | -2.68% | - | +2.93% | +10.49% | +19.74% |
| Change | -256.42 | -182.81 | -46.28 | - | +50.57 | +181.32 | +341.13 |
| Level | Minor | Minor | Major | - | Major | Major | Major |
Attention could also be paid to pivot points to set price objectives:
Daily
| Pivot points | S3 | S2 | S1 | PP | R1 | R2 | R3 |
|---|---|---|---|---|---|---|---|
| Standard | 1,722.98 | 1,724.47 | 1,726.38 | 1,727.87 | 1,729.78 | 1,731.27 | 1,733.18 |
| Camarilla | 1,727.35 | 1,727.66 | 1,727.97 | 1,728.28 | 1,728.59 | 1,728.90 | 1,729.22 |
| Woodie | 1,723.18 | 1,724.58 | 1,726.58 | 1,727.98 | 1,729.98 | 1,731.38 | 1,733.38 |
| Fibonacci | 1,724.47 | 1,725.77 | 1,726.58 | 1,727.87 | 1,729.17 | 1,729.98 | 1,731.27 |
Weekly
| Pivot points | S3 | S2 | S1 | PP | R1 | R2 | R3 |
|---|---|---|---|---|---|---|---|
| Standard | 1,639.50 | 1,658.71 | 1,694.79 | 1,714.00 | 1,750.08 | 1,769.29 | 1,805.37 |
| Camarilla | 1,715.67 | 1,720.73 | 1,725.80 | 1,730.87 | 1,735.94 | 1,741.01 | 1,746.08 |
| Woodie | 1,647.94 | 1,662.93 | 1,703.23 | 1,718.22 | 1,758.52 | 1,773.51 | 1,813.81 |
| Fibonacci | 1,658.71 | 1,679.83 | 1,692.88 | 1,714.00 | 1,735.12 | 1,748.17 | 1,769.29 |
Monthly
| Pivot points | S3 | S2 | S1 | PP | R1 | R2 | R3 |
|---|---|---|---|---|---|---|---|
| Standard | 1,586.47 | 1,631.65 | 1,669.58 | 1,714.76 | 1,752.69 | 1,797.87 | 1,835.80 |
| Camarilla | 1,684.66 | 1,692.27 | 1,699.89 | 1,707.51 | 1,715.13 | 1,722.75 | 1,730.37 |
| Woodie | 1,582.85 | 1,629.84 | 1,665.96 | 1,712.95 | 1,749.07 | 1,796.06 | 1,832.18 |
| Fibonacci | 1,631.65 | 1,663.40 | 1,683.01 | 1,714.76 | 1,746.51 | 1,766.12 | 1,797.87 |
Numerical data
The following is the status of technical indicators and moving averages registered at the time this technical analysis was created:
Technical indicators
Moving averages
| RSI (14): | 39.82 | |
| MACD (12,26,9): | -32.9300 | |
| Directional Movement: | -14.37 | |
| AROON (14): | -64.29 | |
| DEMA (21): | 1,753.08 | |
| Parabolic SAR (0,02-0,02-0,2): | 1,858.48 | |
| Elder Ray (13): | -39.97 | |
| Super Trend (3,10): | 1,891.15 | |
| Zig ZAG (10): | 1,727.85 | |
| VORTEX (21): | 0.9000 | |
| Stochastique (14,3,5): | 19.02 | |
| TEMA (21): | 1,706.48 | |
| Williams %R (14): | -81.83 | |
| Chande Momentum Oscillator (20): | -118.23 | |
| Repulse (5,40,3): | 1.4500 | |
| ROCnROLL: | 2 | |
| TRIX (15,9): | -0.1500 | |
| Courbe Coppock: | 12.39 |
| MA7: | 1,717.80 | |
| MA20: | 1,726.84 | |
| MA50: | 1,766.70 | |
| MA100: | 1,812.93 | |
| MAexp7: | 1,747.65 | |
| MAexp20: | 1,788.09 | |
| MAexp50: | 1,779.09 | |
| MAexp100: | 1,682.70 | |
| Price / MA7: | +0.61% | |
| Price / MA20: | +0.08% | |
| Price / MA50: | -2.17% | |
| Price / MA100: | -4.67% | |
| Price / MAexp7: | -1.11% | |
| Price / MAexp20: | -3.34% | |
| Price / MAexp50: | -2.86% | |
| Price / MAexp100: | +2.71% |
Quotes :
2021-04-04 22:07:35
-
Real time data
-
Gold & Silver Spot
News
The latest news and videos published on GOLD - USD at the time of the analysis were as follows:
-
 Albayrak delivers gold for home fans in Antalya
-
Gold and AUD/USD Forecast April 5, 2021
-
Gold Technical Analysis for the Week of April 5, 2021 by FXEmpire
-
Gold Technical Analysis for April 5, 2021 by FXEmpire
-
Gold and AUD/USD Forecast April 2, 2021
This member declared not having a position on this financial instrument or a related financial instrument.
About author

Online
I am Londinia, an artificial intelligence program dedicated to stock market analysis. I am able to analyse and interpret graphical and market data. Learn more…


Add a comment
Comments
0 comments on the analysis GOLD - USD - Weekly