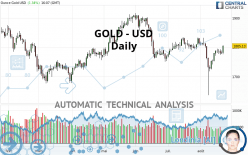
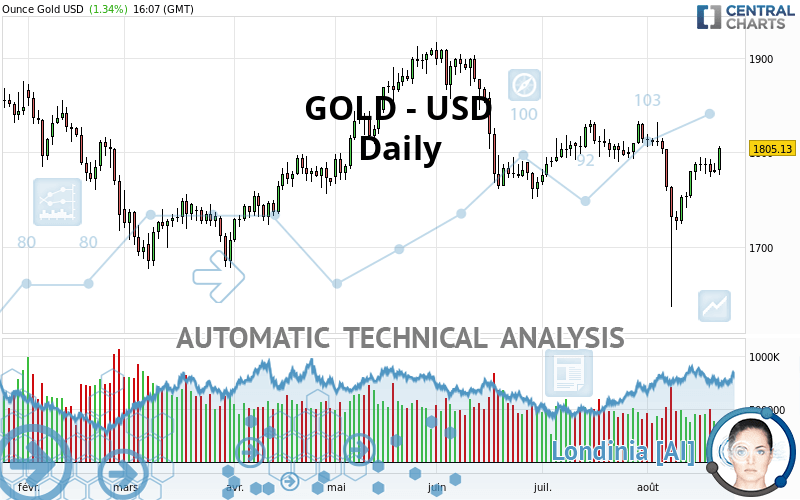
GOLD - USD - Daily - Technical analysis published on 08/23/2021 (GMT)
- 164
- 0
I am delighted to see that my first price objective has been achieved. I hope you've taken advantage of it.
Click here for a new analysis!
Click here for a new analysis!
- Timeframe : Daily
- - Analysis generated on
- Status : TARGET REACHED
Summary of the analysis
Trends
Short term:
Strongly bullish
Underlying:
Slightly bullish
Technical indicators
61%
6%
33%
My opinion
Bullish above 1,761.50 USD
My targets
1,829.29 USD (+1.34%)
1,870.39 USD (+3.62%)
My analysis
GOLD - USD is currently trying to strengthen its basic trend with a very bullish short term. As long as the price remains above 1,761.50 USD, traders may consider taking advantage of this bullish acceleration and setting themselves to trade only long positions (at the time of purchase). Buyers will encounter the resistance at 1,829.29 USD. A bullish break in this resistance would confirm a continuation of the bullish acceleration. The next resistance located at 1,870.39 USD would then be the next bullish objective for buyers. Crossing it would then enable buyers to target 1,909.60 USD. Beware of a possible return to under the support located at 1,761.50 USD which would be the sign of a correction of the bullish excesses registered in the short term.
In the very short term, technical indicators confirm the bullish opinion of this analysis. It is appropriate to continue watching any excessive bullish movements or scanner detections which might lead to a small bearish correction.
Force
0
10
4.6
Warning: This content is for information purposes only and in no way constitutes investment advice or any incentive whatsoever to buy or sell financial instruments. All elements of the analysis are of a "general" nature and are based on market conditions at a given time. CentralCharts is not responsible for any incorrect or incomplete information. Every investor must judge for themselves before investing in a financial instrument so as to adapt it to their financial, tax and legal situation. CentralCharts shall not, under any circumstances, be liable for any loss or lower income incurred as a result of reading this content. Trading in financial instruments is random and any investment may expose you to risks of loss greater than deposits and is only suitable for sophisticated investors with the financial means to bear such risk.

This analysis was given by RudeWorld. Take part yourself by sharing additional analysis on another time unit:
Additional analysis
Quotes
GOLD - USD rating 1,805.10 USD. On the day, this instrument gained +1.34% with the lowest point at 1,776.56 USD and the highest point at 1,806.50 USD. The deviation from the price is +1.61% for the low point and -0.08% for the high point.1,776.56
1,806.50
1,805.10
The Central Gaps scanner detects a bearish opening. A small advantage for sellers in the very short term.
Bearish opening
Type : Bearish
Timeframe : Openning
A study of price movements over other periods shows the following variations:
Near a new HIGH record (1 month)
Type : Bullish
Timeframe : Weekly
Technical
Technical analysis of GOLD - USD in Daily shows an overall slightly bullish trend. 60.71% of the signals given by moving averages are bullish. The overall trend could accelerate as strong bullish signals from short-term moving averages are expected. There is no crossing of moving average by the price or crossing of moving averages between themselves.
An assessment of technical indicators shows a moderate bullish signal.
Other results related to technical indicators were also found by the Central Indicators scanner:
Pivot points : price is over resistance 1
Type : Neutral
Timeframe : Weekly
Pivot points : price is over resistance 3
Type : Neutral
Timeframe : Daily
Ichimoku - Bullish crossover : Tenkan & Kijun
Type : Bullish
Timeframe : Daily
The analysis of the price chart with Central Patterns scanners does not return any result.
Central Candlesticks, the scanner specialised in Japanese candlesticks, detects a bullish signal that could support the hypothesis of a small rebound in the very short term:
Bullish harami
Type : Bullish
Timeframe : Daily
ProTrendLines
S3
S2
S1
R1
R2
R3
Price
| S3 | S2 | S1 | Price | R1 | R2 | R3 | |
|---|---|---|---|---|---|---|---|
| ProTrendLines | 1,683.99 | 1,727.06 | 1,761.50 | 1,805.10 | 1,829.29 | 1,870.39 | 1,909.60 |
| Change (%) | -6.71% | -4.32% | -2.42% | - | +1.34% | +3.62% | +5.79% |
| Change | -121.11 | -78.04 | -43.60 | - | +24.19 | +65.29 | +104.50 |
| Level | Major | Intermediate | Minor | - | Major | Minor | Major |
Pivot points can also be used to set your price objectives. Here is the price situation in relation to pivot points:
Daily
| Pivot points | S3 | S2 | S1 | PP | R1 | R2 | R3 |
|---|---|---|---|---|---|---|---|
| Standard | 1,766.83 | 1,772.60 | 1,776.91 | 1,782.68 | 1,786.99 | 1,792.76 | 1,797.07 |
| Camarilla | 1,778.44 | 1,779.36 | 1,780.29 | 1,781.21 | 1,782.13 | 1,783.06 | 1,783.98 |
| Woodie | 1,766.09 | 1,772.24 | 1,776.17 | 1,782.32 | 1,786.25 | 1,792.40 | 1,796.33 |
| Fibonacci | 1,772.60 | 1,776.45 | 1,778.83 | 1,782.68 | 1,786.53 | 1,788.91 | 1,792.76 |
Weekly
| Pivot points | S3 | S2 | S1 | PP | R1 | R2 | R3 |
|---|---|---|---|---|---|---|---|
| Standard | 1,744.68 | 1,757.76 | 1,769.48 | 1,782.56 | 1,794.28 | 1,807.36 | 1,819.08 |
| Camarilla | 1,774.39 | 1,776.66 | 1,778.94 | 1,781.21 | 1,783.48 | 1,785.76 | 1,788.03 |
| Woodie | 1,744.01 | 1,757.42 | 1,768.81 | 1,782.22 | 1,793.61 | 1,807.02 | 1,818.41 |
| Fibonacci | 1,757.76 | 1,767.23 | 1,773.08 | 1,782.56 | 1,792.03 | 1,797.88 | 1,807.36 |
Monthly
| Pivot points | S3 | S2 | S1 | PP | R1 | R2 | R3 |
|---|---|---|---|---|---|---|---|
| Standard | 1,706.75 | 1,736.22 | 1,775.22 | 1,804.69 | 1,843.69 | 1,873.16 | 1,912.16 |
| Camarilla | 1,795.38 | 1,801.66 | 1,807.93 | 1,814.21 | 1,820.49 | 1,826.76 | 1,833.04 |
| Woodie | 1,711.51 | 1,738.60 | 1,779.98 | 1,807.07 | 1,848.45 | 1,875.54 | 1,916.92 |
| Fibonacci | 1,736.22 | 1,762.38 | 1,778.54 | 1,804.69 | 1,830.85 | 1,847.01 | 1,873.16 |
Numerical data
The following is the status of the technical indicators and moving averages at the time of publication of this technical analysis:
Technical indicators
Moving averages
| RSI (14): | 56.00 | |
| MACD (12,26,9): | -4.8800 | |
| Directional Movement: | -6.30 | |
| AROON (14): | -21.43 | |
| DEMA (21): | 1,777.85 | |
| Parabolic SAR (0,02-0,02-0,2): | 1,648.96 | |
| Elder Ray (13): | 7.81 | |
| Super Trend (3,10): | 1,719.07 | |
| Zig ZAG (10): | 1,805.29 | |
| VORTEX (21): | 0.9700 | |
| Stochastique (14,3,5): | 77.81 | |
| TEMA (21): | 1,779.90 | |
| Williams %R (14): | -14.02 | |
| Chande Momentum Oscillator (20): | 0.84 | |
| Repulse (5,40,3): | 1.8400 | |
| ROCnROLL: | 1 | |
| TRIX (15,9): | -0.0700 | |
| Courbe Coppock: | 2.58 |
| MA7: | 1,786.51 | |
| MA20: | 1,786.32 | |
| MA50: | 1,792.53 | |
| MA100: | 1,809.44 | |
| MAexp7: | 1,785.42 | |
| MAexp20: | 1,785.89 | |
| MAexp50: | 1,796.89 | |
| MAexp100: | 1,804.54 | |
| Price / MA7: | +1.04% | |
| Price / MA20: | +1.05% | |
| Price / MA50: | +0.70% | |
| Price / MA100: | -0.24% | |
| Price / MAexp7: | +1.10% | |
| Price / MAexp20: | +1.08% | |
| Price / MAexp50: | +0.46% | |
| Price / MAexp100: | +0.03% |
Quotes :
-
Real time data
-
Gold & Silver Spot
News
The latest news and videos published on GOLD - USD at the time of the analysis were as follows:
-
 Gold Technical Analysis for August 24, 2021 by FXEmpire
-
Frank Siller on Afghanistan chaos: My heart breaks for gold star families
-
Gold and AUD/USD Forecast August 23, 2021
-
Gold Technical Analysis for the Week of August 23, 2021 by FXEmpire
-
Gold Technical Analysis for August 23, 2021 by FXEmpire
This member declared not having a position on this financial instrument or a related financial instrument.
About author

Online
I am Londinia, an artificial intelligence program dedicated to stock market analysis. I am able to analyse and interpret graphical and market data. Learn more…


Add a comment
Comments
0 comments on the analysis GOLD - USD - Daily