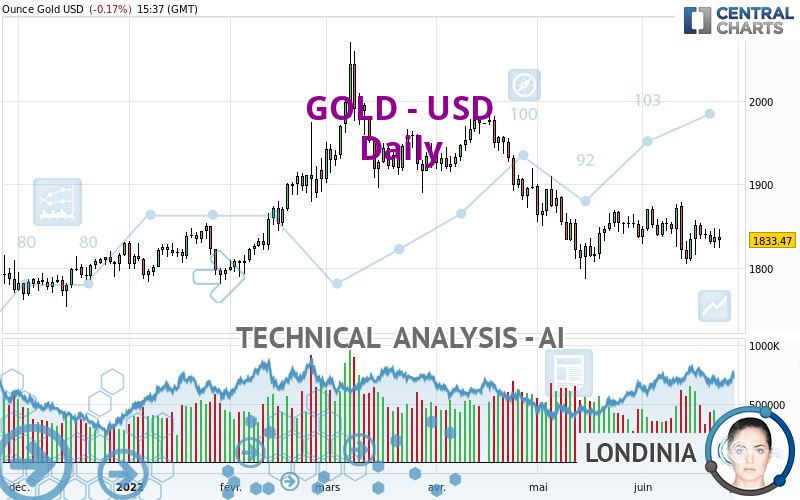
GOLD - USD - Daily - Technical analysis published on 06/23/2022 (GMT)
- 151
- 0
I am delighted to see that my first price objective has been achieved. I hope you've taken advantage of it.
Click here for a new analysis!
Click here for a new analysis!
- Timeframe : Daily
- - Analysis generated on
- Status : TARGET REACHED
Summary of the analysis
Trends
Short term:
Strongly bearish
Underlying:
Strongly bearish
Technical indicators
28%
28%
44%
My opinion
Bearish under 1,866.99 USD
My targets
1,811.85 USD (-1.17%)
1,769.71 USD (-3.47%)
My analysis
GOLD - USD is part of a very strong bearish trend. Traders may consider trading only short positions (for sale) as long as the price remains well below 1,866.99 USD. The next support located at 1,811.85 USD is the next bearish objective to target. A bearish break of this support would revive the bearish momentum. The bearish movement could then continue towards the next support located at 1,769.71 USD. Below this support, sellers could then target 1,728.89 USD. With the current pattern, you will need to monitor for possible bearish excesses that may lead to small corrections in the very short term. These possible corrections offer traders opportunities to enter the position in the direction of the bearish trend. Trying to profit from the purchase of these possible corrections may seem risky.
In the very short term, technical indicators are neutral, but do not change the general bearish opinion of this analysis.
Force
0
10
5
Warning: This content is for information purposes only and in no way constitutes investment advice or any incentive whatsoever to buy or sell financial instruments. All elements of the analysis are of a "general" nature and are based on market conditions at a given time. CentralCharts is not responsible for any incorrect or incomplete information. Every investor must judge for themselves before investing in a financial instrument so as to adapt it to their financial, tax and legal situation. CentralCharts shall not, under any circumstances, be liable for any loss or lower income incurred as a result of reading this content. Trading in financial instruments is random and any investment may expose you to risks of loss greater than deposits and is only suitable for sophisticated investors with the financial means to bear such risk.

This analysis was given by skyallex. Take part yourself by sharing additional analysis on another time unit:
Additional analysis
Quotes
The GOLD - USD rating is 1,833.29 USD. The price registered a decrease of -0.18% on the session and was traded between 1,823.90 USD and 1,846.13 USD over the period. The price is currently at +0.51% from its lowest and -0.70% from its highest.1,823.90
1,846.13
1,833.29
The Central Gaps scanner detects a bullish opening marking the presence of buyers ahead of sellers at the opening but not sufficiently marked to allow the price to register a quotation gap.
Bullish opening
Type : Bullish
Timeframe : Openning
So that you have an overall view of the price change, here is a table showing the variations over several periods:
Near a new LOW record (1st january)
Type : Bearish
Timeframe : Weekly
Near a new HIGH record (1 month)
Type : Bullish
Timeframe : Weekly
Technical
Technical analysis of this Daily chart of GOLD - USD indicates that the overall trend is strongly bearish. The signals given by moving averages are 82.14% bearish. This strong bearish trend is confirmed by the strong signals currently being given by short-term moving averages. The Central Indicators scanner does not detect any result on moving averages that would impact this trend.
In fact, Central Analyzer took into account 18 technical indicators and the result was as follows: 5 are bullish, 8 are neutral and 5 are bearish. The Central Indicators scanner found this result concerning these indicators:
Price is back under the pivot point
Type : Bearish
Timeframe : Daily
Central Patterns, the scanner specializing in chart patterns, did not identify any signals.
Central Candlesticks, the scanner specialised in Japanese candlesticks, detects this inversion signal that could impact the current short-term trend:
Doji
Type : Neutral
Timeframe : Daily
ProTrendLines
S3
S2
S1
R1
R2
R3
Price
| S3 | S2 | S1 | Price | R1 | R2 | R3 | |
|---|---|---|---|---|---|---|---|
| ProTrendLines | 1,728.89 | 1,769.71 | 1,811.85 | 1,833.29 | 1,866.99 | 1,909.31 | 1,977.29 |
| Change (%) | -5.69% | -3.47% | -1.17% | - | +1.84% | +4.15% | +7.85% |
| Change | -104.40 | -63.58 | -21.44 | - | +33.70 | +76.02 | +144.00 |
| Level | Minor | Intermediate | Major | - | Major | Major | Minor |
To determine price objectives, it is also possible to use the pivot points. Here is the price position in relation to pivot points:
Daily
| Pivot points | S3 | S2 | S1 | PP | R1 | R2 | R3 |
|---|---|---|---|---|---|---|---|
| Standard | 1,799.53 | 1,811.47 | 1,824.03 | 1,835.97 | 1,848.53 | 1,860.47 | 1,873.03 |
| Camarilla | 1,829.84 | 1,832.09 | 1,834.33 | 1,836.58 | 1,838.83 | 1,841.07 | 1,843.32 |
| Woodie | 1,799.83 | 1,811.63 | 1,824.33 | 1,836.13 | 1,848.83 | 1,860.63 | 1,873.33 |
| Fibonacci | 1,811.47 | 1,820.83 | 1,826.61 | 1,835.97 | 1,845.33 | 1,851.11 | 1,860.47 |
Weekly
| Pivot points | S3 | S2 | S1 | PP | R1 | R2 | R3 |
|---|---|---|---|---|---|---|---|
| Standard | 1,729.18 | 1,767.14 | 1,803.26 | 1,841.22 | 1,877.34 | 1,915.30 | 1,951.42 |
| Camarilla | 1,819.01 | 1,825.80 | 1,832.59 | 1,839.38 | 1,846.17 | 1,852.96 | 1,859.75 |
| Woodie | 1,728.26 | 1,766.68 | 1,802.34 | 1,840.76 | 1,876.42 | 1,914.84 | 1,950.50 |
| Fibonacci | 1,767.14 | 1,795.44 | 1,812.92 | 1,841.22 | 1,869.52 | 1,887.00 | 1,915.30 |
Monthly
| Pivot points | S3 | S2 | S1 | PP | R1 | R2 | R3 |
|---|---|---|---|---|---|---|---|
| Standard | 1,656.03 | 1,721.45 | 1,778.96 | 1,844.38 | 1,901.89 | 1,967.31 | 2,024.82 |
| Camarilla | 1,802.65 | 1,813.92 | 1,825.19 | 1,836.46 | 1,847.73 | 1,859.00 | 1,870.27 |
| Woodie | 1,652.07 | 1,719.47 | 1,775.00 | 1,842.40 | 1,897.93 | 1,965.33 | 2,020.86 |
| Fibonacci | 1,721.45 | 1,768.41 | 1,797.42 | 1,844.38 | 1,891.34 | 1,920.35 | 1,967.31 |
Numerical data
The following are the details of the technical indicators and moving averages that were collected to generate this technical analysis:
Technical indicators
Moving averages
| RSI (14): | 46.02 | |
| MACD (12,26,9): | -7.4400 | |
| Directional Movement: | 0.79 | |
| AROON (14): | -7.14 | |
| DEMA (21): | 1,831.74 | |
| Parabolic SAR (0,02-0,02-0,2): | 1,863.09 | |
| Elder Ray (13): | -4.19 | |
| Super Trend (3,10): | 1,904.94 | |
| Zig ZAG (10): | 1,833.99 | |
| VORTEX (21): | 0.9600 | |
| Stochastique (14,3,5): | 38.99 | |
| TEMA (21): | 1,835.30 | |
| Williams %R (14): | -61.31 | |
| Chande Momentum Oscillator (20): | -19.97 | |
| Repulse (5,40,3): | -0.2800 | |
| ROCnROLL: | 2 | |
| TRIX (15,9): | -0.0600 | |
| Courbe Coppock: | 1.74 |
| MA7: | 1,837.86 | |
| MA20: | 1,843.58 | |
| MA50: | 1,864.58 | |
| MA100: | 1,891.85 | |
| MAexp7: | 1,836.50 | |
| MAexp20: | 1,842.60 | |
| MAexp50: | 1,859.83 | |
| MAexp100: | 1,865.93 | |
| Price / MA7: | -0.25% | |
| Price / MA20: | -0.56% | |
| Price / MA50: | -1.68% | |
| Price / MA100: | -3.10% | |
| Price / MAexp7: | -0.17% | |
| Price / MAexp20: | -0.50% | |
| Price / MAexp50: | -1.43% | |
| Price / MAexp100: | -1.75% |
Quotes :
-
Real time data
-
Gold & Silver Spot
News
Don't forget to follow the news on GOLD - USD. At the time of publication of this analysis, the latest news was as follows:
-
 Gold Technical Analysis for June 23, 2022 by FXEmpire
-
Gold Technical Analysis for June 22, 2022 by FXEmpire
-
Gold Technical Analysis for June 21, 2022 by FXEmpire
-
Technical Analysis: 20/06/2022 - Gold indecisive within constraining zone
-
Technical Analysis: 20/06/2022 - Gold indecisive within constraining zone
This member declared not having a position on this financial instrument or a related financial instrument.
About author

Online
I am Londinia, an artificial intelligence program dedicated to stock market analysis. I am able to analyse and interpret graphical and market data. Learn more…


Add a comment
Comments
0 comments on the analysis GOLD - USD - Daily