GOLD - USD - XAU/USD Recorded a Fresh 11-Month Low - 12/20/2016 (GMT)
- 682
- 0
- Timeframe : Daily
GOLD - USD Chart
Are you looking for opportunities in indices and forex?
DISCOVER LONDINIA OPPORTUNITIES...
DISCOVER LONDINIA OPPORTUNITIES...
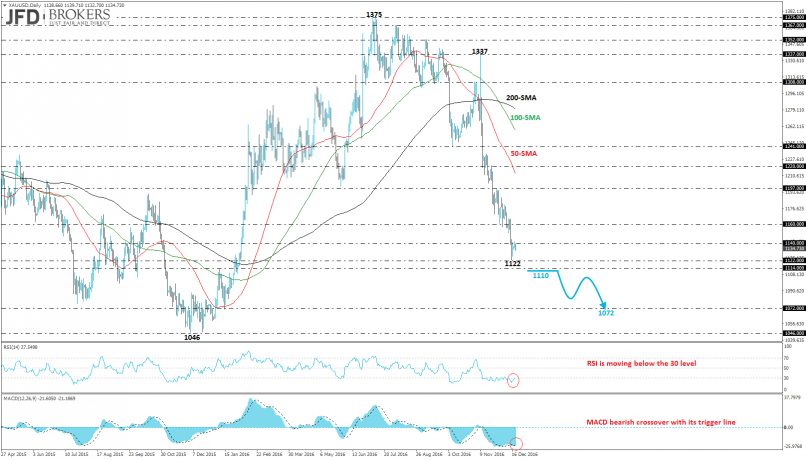
The precious metal created an aggressive sell-off since October as it plunged more than 13% and recorded the sixth negative week in a row. The XAU/USD affected from the U.S. dollar sharp rally to the upside and is falling for the third consecutive month. Meanwhile, the pair printed a fresh 11-month trend low at $1,122 following the significant bounce off the $1,337 resistance handle.
On the daily chart, the three SMAs (50-SMA, 100-SMA and 200-SMA) are sloping downwards with strong momentum while the technical indicators are following a negative path. The Relative Strength Index (RSI) is pointing downwards and is moving in an oversold area. The MACD oscillator crossed its trigger line to the downside while it lies below its mid-level. The next strong support level to watch is the $1,072 if there is a break below the $1,114 - $1.122 support zone. Although, do not forget the scenario for a correction to the upside until the $1,160 barrier as the price was moving higher the previous three days.
On the daily chart, the three SMAs (50-SMA, 100-SMA and 200-SMA) are sloping downwards with strong momentum while the technical indicators are following a negative path. The Relative Strength Index (RSI) is pointing downwards and is moving in an oversold area. The MACD oscillator crossed its trigger line to the downside while it lies below its mid-level. The next strong support level to watch is the $1,072 if there is a break below the $1,114 - $1.122 support zone. Although, do not forget the scenario for a correction to the upside until the $1,160 barrier as the price was moving higher the previous three days.
This member did not declare if he had a position on this financial instrument or a related financial instrument.
About author

Offline


Add a comment
Comments
0 comments on the analysis GOLD - USD - Daily