GOLD - USD - Slipped Below 50.0% Fibo Level - 02/13/2017 (GMT)
- Who voted?
- 492
- 0
- Timeframe : Daily
GOLD - USD Chart
Are you looking for opportunities in indices and forex?
DISCOVER LONDINIA OPPORTUNITIES...
DISCOVER LONDINIA OPPORTUNITIES...
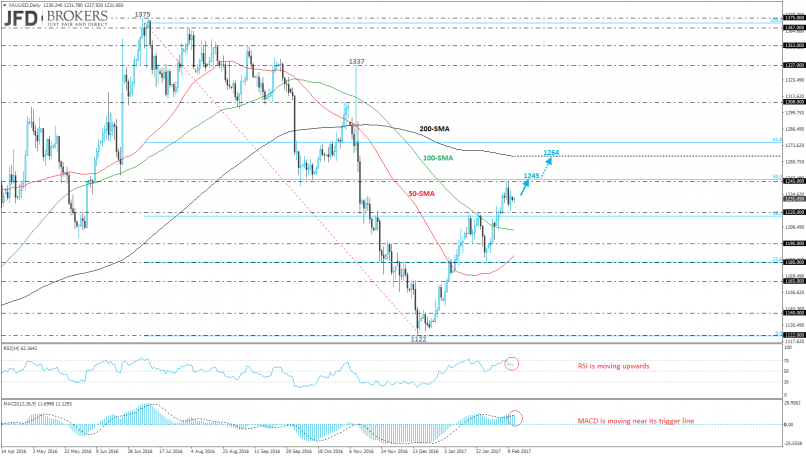
The yellow metal jumped more than 1.1% over last week’s session and found an obstacle on the $1,245 resistance barrier which coincides with the 50.0% Fibonacci retracement level of the downward significant move with high at $1,375 on 6th of July 2016 until the low at $1,122 on 15th of December 2016.
The XAU/USD pair is moving upwards since December and if the price surpasses the aforementioned fibo level, it would open the way for the 200-SMA near the $1,260 on the daily chart. The 50-daily SMA is sloping upwards and is approaching the 100-daily SMA while technical indicators are endorsing the upward movement. The RSI indicator is moving higher and is following a positive path while MACD is moving above zero line near its trigger line.
The XAU/USD pair is moving upwards since December and if the price surpasses the aforementioned fibo level, it would open the way for the 200-SMA near the $1,260 on the daily chart. The 50-daily SMA is sloping upwards and is approaching the 100-daily SMA while technical indicators are endorsing the upward movement. The RSI indicator is moving higher and is following a positive path while MACD is moving above zero line near its trigger line.
This member did not declare if he had a position on this financial instrument or a related financial instrument.
About author

Offline


Add a comment
Comments
0 comments on the analysis GOLD - USD - Daily