GOLD - USD - Extended its Gains - Next Critical Level $1,292 - 06/06/2017 (GMT)
- Who voted?
- 308
- 0
- Timeframe : Daily
GOLD - USD Chart
Are you looking for opportunities in indices and forex?
DISCOVER LONDINIA OPPORTUNITIES...
DISCOVER LONDINIA OPPORTUNITIES...
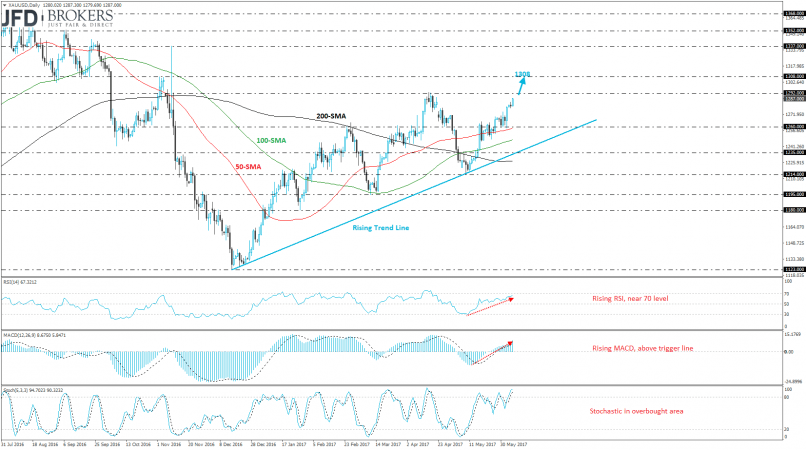
The precious metal edged sharply higher over the last four weeks and surged more than 4%. The XAU/USD pair completed a seven-week high at $1,287 early this morning after the pullback on the $1,260 support barrier. The bullish trend is holding since December of 2016 and we are waiting for additional gains the next sessions.
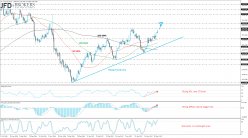
Technically, on the daily timeframe, the jump above the $1,260 price level will push the price until the $1,292 strong resistance handle or moreover until the $1,308 barrier. The stochastic oscillator entered the overbought path with strong momentum whilst the RSI indicator is following a bullish area and the MACD oscillator climbed above the trigger line. In addition, on the 4-hour chart, the 100-SMA completed a bullish crossover with the 200-SMA indicating further upside movement.
Technically, on the daily timeframe, the jump above the $1,260 price level will push the price until the $1,292 strong resistance handle or moreover until the $1,308 barrier. The stochastic oscillator entered the overbought path with strong momentum whilst the RSI indicator is following a bullish area and the MACD oscillator climbed above the trigger line. In addition, on the 4-hour chart, the 100-SMA completed a bullish crossover with the 200-SMA indicating further upside movement.
This member did not declare if he had a position on this financial instrument or a related financial instrument.
About author

Offline


Add a comment
Comments
0 comments on the analysis GOLD - USD - Daily