GOLD - USD - Back to the $1,260 Key Level? - 06/12/2017 (GMT)
- Who voted?
- 430
- 0
- Timeframe : Daily
GOLD - USD Chart
Are you looking for opportunities in indices and forex?
DISCOVER LONDINIA OPPORTUNITIES...
DISCOVER LONDINIA OPPORTUNITIES...
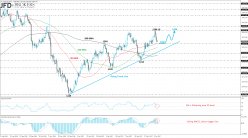
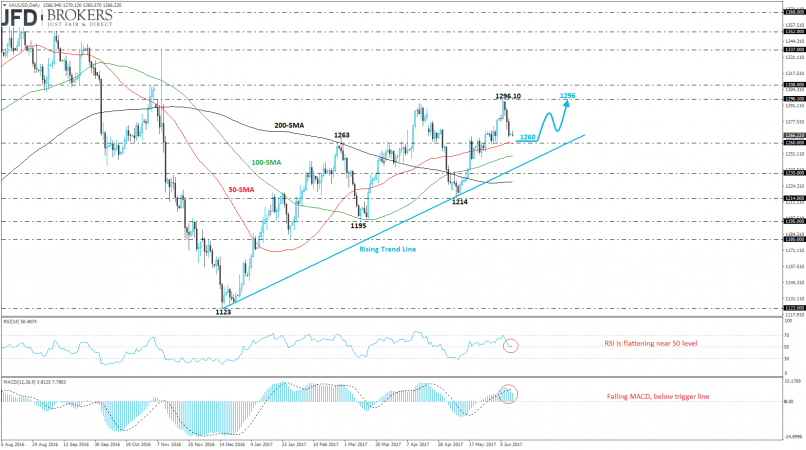
The yellow metal topped near the $1,296 resistance level and hit a seven-month high over the previous week. The XAU/USD pair snapped four consecutive winning weeks and plunged almost 1% approaching the $1,260 support barrier which is overlapping with the 50-weekly SMA as well as with the 50-daily SMA.
Technically, the next immediate support at $1,260 is a strong obstacle for the bears as there are significant levels for the price to pass through them on the daily chart. Additionally, on the weekly timeframe, the three simple moving averages are moving sideways acting as strong supports. Our expectation is a failed attempt to slip below them and we are waiting for an upward trend until the $1,296 handle. The Relative Strength Index (RSI) is flattening near the 50 level and the MACD oscillator is moving lower in the bullish path.
Technically, the next immediate support at $1,260 is a strong obstacle for the bears as there are significant levels for the price to pass through them on the daily chart. Additionally, on the weekly timeframe, the three simple moving averages are moving sideways acting as strong supports. Our expectation is a failed attempt to slip below them and we are waiting for an upward trend until the $1,296 handle. The Relative Strength Index (RSI) is flattening near the 50 level and the MACD oscillator is moving lower in the bullish path.
This member did not declare if he had a position on this financial instrument or a related financial instrument.
About author

Offline


Add a comment
Comments
0 comments on the analysis GOLD - USD - Daily