GOLD - USD - Slipped Sharply Lower - Target Locked at $1,240.40 - 06/27/2017 (GMT)
- Who voted?
- 480
- 0
- Timeframe : Daily
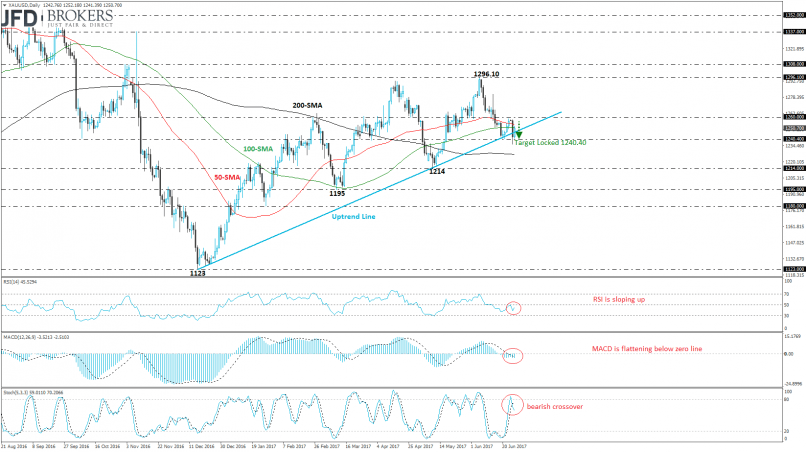
GOLD - USD Chart
Are you looking for opportunities in indices and forex?
DISCOVER LONDINIA OPPORTUNITIES...
DISCOVER LONDINIA OPPORTUNITIES...
Gold edged sharply lower on Monday, as traders begin to focus on the upcoming comments from Fed officials, including Janet Yellen. The yellow metal plummeted more than 1% in just one trading period and recorded a fresh six-month low at $1,236. Moreover, the XAU/USD pair hit our recommended target at $1240.40 that we referred in a previous analysis (see technical analysis here: http://bit.ly/2s7Cub6).
From a technical point of view, the metal had a bounce off the $1,240.40 support level and now is trading higher. It worth mentioning that the price penetrated the ascending trend line which is holding since December, to the downside and now is challenging the 100-day SMA. The RSI indicator is sloping upwards while the stochastic oscillator created a bearish crossover after the bounce off the overbought area. Also, the MACD oscillator is flattening in the negative territory. The initial target to watch is the $1,260 resistance level, however, there are significant obstacles until that level, the 50 and 100 day SMAs.
From a technical point of view, the metal had a bounce off the $1,240.40 support level and now is trading higher. It worth mentioning that the price penetrated the ascending trend line which is holding since December, to the downside and now is challenging the 100-day SMA. The RSI indicator is sloping upwards while the stochastic oscillator created a bearish crossover after the bounce off the overbought area. Also, the MACD oscillator is flattening in the negative territory. The initial target to watch is the $1,260 resistance level, however, there are significant obstacles until that level, the 50 and 100 day SMAs.
This member did not declare if he had a position on this financial instrument or a related financial instrument.
About author

Offline


Add a comment
Comments
0 comments on the analysis GOLD - USD - Daily