GOLD - USD - Plummeted 1.2% and Broke the Rising Trend Line - 07/03/2017 (GMT)
- Who voted?
- 394
- 0
- Timeframe : Daily
GOLD - USD Chart
Are you looking for opportunities in indices and forex?
DISCOVER LONDINIA OPPORTUNITIES...
DISCOVER LONDINIA OPPORTUNITIES...
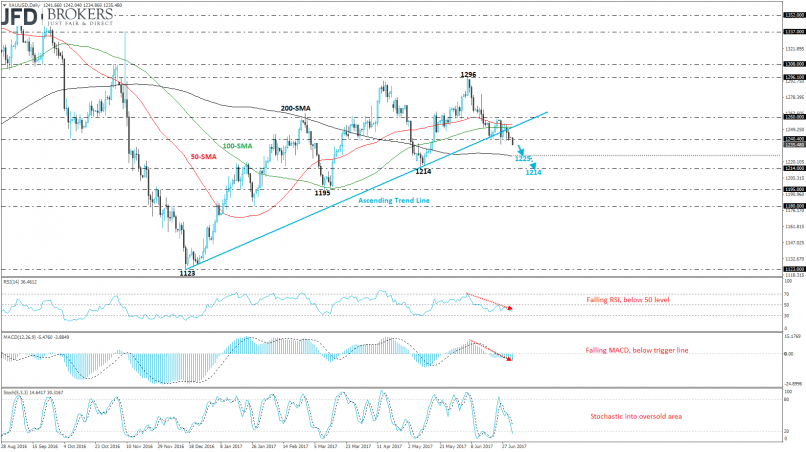
The yellow metal is plummeting over the last sessions as it broke the ascending trend line to the downside that was standing since December 2016. The XAU/USD pair plunged more than 1.2% since last week and recorded the second bearish month in a row. Moreover, the price is hovering around the seven-week low at $1,235.
The technical indicators are confirming the recent bearish attitude. The RSI indicator is falling below the 50 level with strong momentum as well as the MACD oscillator which is holding below its trigger line. The stochastic oscillator fell into the oversold area while the 50 and 100 day SMAs are acting as strong resistance levels on price. The next levels to have in mind are the $1,225 which overlaps with the 200-day SMA and the $1,214 support handle.
The technical indicators are confirming the recent bearish attitude. The RSI indicator is falling below the 50 level with strong momentum as well as the MACD oscillator which is holding below its trigger line. The stochastic oscillator fell into the oversold area while the 50 and 100 day SMAs are acting as strong resistance levels on price. The next levels to have in mind are the $1,225 which overlaps with the 200-day SMA and the $1,214 support handle.
This member did not declare if he had a position on this financial instrument or a related financial instrument.
About author

Offline


Add a comment
Comments
0 comments on the analysis GOLD - USD - Daily