GOLD - USD - Plunged and Hit Our Recommended Target at $1,214 - 07/10/2017 (GMT)
- Who voted?
- 530
- 0
- Timeframe : Daily
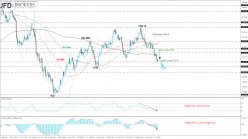

GOLD - USD Chart
Are you looking for opportunities in indices and forex?
DISCOVER LONDINIA OPPORTUNITIES...
DISCOVER LONDINIA OPPORTUNITIES...
The yellow metal plunged almost 5% since May while it slipped below the 50-month SMA, creating the third red month in a row. On a weekly timeframe, the XAU/USD pair printed two red weeks and approached the lower band of the Bollinger Band. Meanwhile, the price hit the $1,207 price level and posted a new four-month low.
Our prediction for further losses in the previous analysis verified and the precious metal reached our recommended target at $1,214 (see our technical analysis here: http://bit.ly/2tDJeNL). Now, the price is trying to slip below the fresh low near the lower band of the Bollinger Band and the immediate support is at $1,195. RSI declined below the 30 level and inserted the oversold path whilst MACD is moving far away from its trigger line in the bearish territory.
Our prediction for further losses in the previous analysis verified and the precious metal reached our recommended target at $1,214 (see our technical analysis here: http://bit.ly/2tDJeNL). Now, the price is trying to slip below the fresh low near the lower band of the Bollinger Band and the immediate support is at $1,195. RSI declined below the 30 level and inserted the oversold path whilst MACD is moving far away from its trigger line in the bearish territory.
This member did not declare if he had a position on this financial instrument or a related financial instrument.
About author

Offline


Add a comment
Comments
0 comments on the analysis GOLD - USD - Daily