GOLD - USD - Surges and Recorded a One-Year High at $1,337 - 09/04/2017 (GMT)
- Who voted?
- 342
- 0
- Timeframe : Daily
GOLD - USD Chart
Are you looking for opportunities in indices and forex?
DISCOVER LONDINIA OPPORTUNITIES...
DISCOVER LONDINIA OPPORTUNITIES...
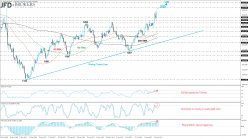
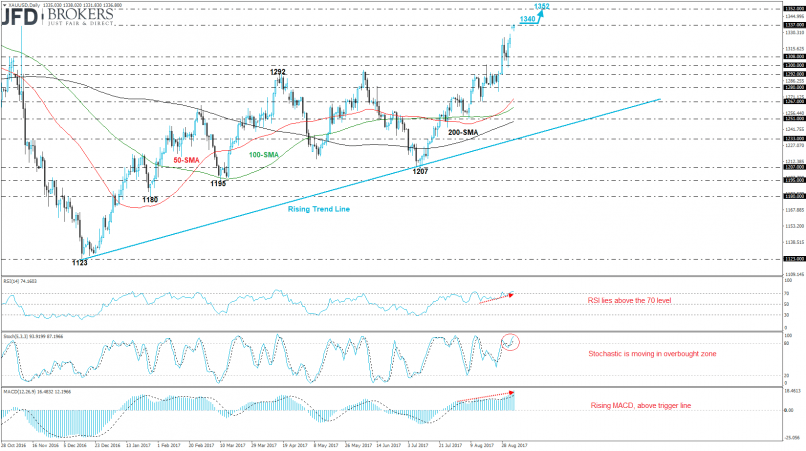
The precious metal had an aggressive bullish run over the last two months and added more than 7.5% to its performance following the bounce off the 50-month SMA. During the previous week, the sharp buying interest of the XAU/USD pair drove the price towards a one-year high at $1,337 resistance level. Yesterday’s quiet period opened with a gap-up due to the nuclear test by North Korea and now we are expecting a further upside movement until the $1,352 handle.
Technically, on the daily timeframe, the RSI indicator climbed above the 70 level and entered into the overbought zone. Also, the stochastic oscillator remains into the bullish path, while the MACD oscillator is moving with strong momentum above the trigger line into the positive territory
Technically, on the daily timeframe, the RSI indicator climbed above the 70 level and entered into the overbought zone. Also, the stochastic oscillator remains into the bullish path, while the MACD oscillator is moving with strong momentum above the trigger line into the positive territory
This member did not declare if he had a position on this financial instrument or a related financial instrument.
About author

Offline


Add a comment
Comments
0 comments on the analysis GOLD - USD - Daily