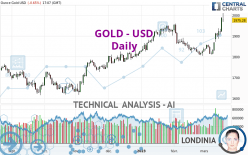
GOLD - USD - Daily - Technical analysis published on 03/20/2023 (GMT)
- 102
- 0
Click here for a new analysis!
- Timeframe : Daily
- - Analysis generated on
- Status : LEVEL MAINTAINED

Summary of the analysis

Additional analysis
Quotes
GOLD - USD rating 1,975.27 USD. The price is lower by -0.65% since the last closing and was between 1,965.92 USD and 2,009.84 USD. This implies that the price is at +0.48% from its lowest and at -1.72% from its highest.The Central Gaps scanner detects a bearish opening marking the presence of sellers ahead of buyers at the opening but not sufficiently marked to allow the price to register a quotation gap.
Bearish opening
Type : Bearish
Timeframe : Openning
A study of price movements over other periods shows the following variations:
Near a new HIGH record (5 years)
Type : Bullish
Timeframe : Weekly
New HIGH record (1 year)
Type : Bullish
Timeframe : Weekly
New HIGH record (1st january)
Type : Bullish
Timeframe : Weekly
New HIGH record (1 month)
Type : Bullish
Timeframe : Weekly
Technical
A technical analysis in Daily of this GOLD - USD chart shows a strongly bullish trend. The signals given by the moving averages are 89.29% bullish. This strong bullish trend is confirmed by the strong signals currently being given by short-term moving averages. The Central Indicators market scanner is currently detecting a bullish signal that could impact this trend:
Moving Average bullish crossovers : AMA20 & AMA50
Type : Bullish
Timeframe : Daily
In fact, according to the parameters integrated into the Central Analyzer system, 15 technical indicators out of 18 analysed are currently bullish. But beware of excesses. The Central Indicators scanner currently detects this:
RSI indicator is overbought : over 70
Type : Neutral
Timeframe : Daily
CCI indicator is overbought : over 100
Type : Neutral
Timeframe : Daily
Previous candle closed over Bollinger bands
Type : Neutral
Timeframe : Daily
CCI indicator: bearish divergence
Type : Bearish
Timeframe : Daily
Williams %R indicator is overbought : over -20
Type : Neutral
Timeframe : Daily
Central Patterns, the scanner specializing in chart patterns, did not identify any signals.
Central Candlesticks, the scanner specialised in Japanese candlesticks, detects these signals that could have an impact on the current short-term trend:
Bearish harami
Type : Bearish
Timeframe : Daily
Doji
Type : Neutral
Timeframe : Daily
| S3 | S2 | S1 | Price | R1 | |
|---|---|---|---|---|---|
| ProTrendLines | 1,812.77 | 1,909.31 | 1,953.13 | 1,975.27 | 2,069.41 |
| Change (%) | -8.23% | -3.34% | -1.12% | - | +4.77% |
| Change | -162.50 | -65.96 | -22.14 | - | +94.14 |
| Level | Major | Major | Minor | - | Intermediate |
Attention could also be paid to pivot points to set price objectives:
| Pivot points | S3 | S2 | S1 | PP | R1 | R2 | R3 |
|---|---|---|---|---|---|---|---|
| Standard | 1,870.10 | 1,894.18 | 1,941.18 | 1,965.26 | 2,012.26 | 2,036.34 | 2,083.34 |
| Camarilla | 1,968.63 | 1,975.15 | 1,981.66 | 1,988.18 | 1,994.70 | 2,001.21 | 2,007.73 |
| Woodie | 1,881.56 | 1,899.91 | 1,952.64 | 1,970.99 | 2,023.72 | 2,042.07 | 2,094.80 |
| Fibonacci | 1,894.18 | 1,921.33 | 1,938.11 | 1,965.26 | 1,992.41 | 2,009.19 | 2,036.34 |
| Pivot points | S3 | S2 | S1 | PP | R1 | R2 | R3 |
|---|---|---|---|---|---|---|---|
| Standard | 1,792.22 | 1,831.87 | 1,910.03 | 1,949.68 | 2,027.84 | 2,067.49 | 2,145.65 |
| Camarilla | 1,955.78 | 1,966.58 | 1,977.38 | 1,988.18 | 1,998.98 | 2,009.78 | 2,020.58 |
| Woodie | 1,811.47 | 1,841.50 | 1,929.28 | 1,959.31 | 2,047.09 | 2,077.12 | 2,164.90 |
| Fibonacci | 1,831.87 | 1,876.88 | 1,904.68 | 1,949.68 | 1,994.69 | 2,022.49 | 2,067.49 |
| Pivot points | S3 | S2 | S1 | PP | R1 | R2 | R3 |
|---|---|---|---|---|---|---|---|
| Standard | 1,612.22 | 1,708.55 | 1,767.09 | 1,863.42 | 1,921.96 | 2,018.29 | 2,076.83 |
| Camarilla | 1,783.05 | 1,797.25 | 1,811.44 | 1,825.64 | 1,839.84 | 1,854.03 | 1,868.23 |
| Woodie | 1,593.34 | 1,699.10 | 1,748.21 | 1,853.97 | 1,903.08 | 2,008.84 | 2,057.95 |
| Fibonacci | 1,708.55 | 1,767.71 | 1,804.26 | 1,863.42 | 1,922.58 | 1,959.13 | 2,018.29 |
Numerical data
The following is the status of technical indicators and moving averages registered at the time this technical analysis was created:
| RSI (14): | 71.06 | |
| MACD (12,26,9): | 24.7100 | |
| Directional Movement: | 30.89 | |
| AROON (14): | 100.00 | |
| DEMA (21): | 1,911.42 | |
| Parabolic SAR (0,02-0,02-0,2): | 1,845.14 | |
| Elder Ray (13): | 85.35 | |
| Super Trend (3,10): | 1,888.93 | |
| Zig ZAG (10): | 1,976.11 | |
| VORTEX (21): | 1.2600 | |
| Stochastique (14,3,5): | 90.21 | |
| TEMA (21): | 1,936.19 | |
| Williams %R (14): | -16.61 | |
| Chande Momentum Oscillator (20): | 138.75 | |
| Repulse (5,40,3): | 3.1100 | |
| ROCnROLL: | 1 | |
| TRIX (15,9): | 0.0400 | |
| Courbe Coppock: | 10.49 |
| MA7: | 1,927.37 | |
| MA20: | 1,863.26 | |
| MA50: | 1,881.94 | |
| MA100: | 1,827.90 | |
| MAexp7: | 1,931.28 | |
| MAexp20: | 1,887.47 | |
| MAexp50: | 1,865.20 | |
| MAexp100: | 1,837.56 | |
| Price / MA7: | +2.49% | |
| Price / MA20: | +6.01% | |
| Price / MA50: | +4.96% | |
| Price / MA100: | +8.06% | |
| Price / MAexp7: | +2.28% | |
| Price / MAexp20: | +4.65% | |
| Price / MAexp50: | +5.90% | |
| Price / MAexp100: | +7.49% |
News
Don't forget to follow the news on GOLD - USD. At the time of publication of this analysis, the latest news was as follows:
-
 Gold Technical Analysis for March 21, 2023 by FXEmpire
-
Oil falls, Gold jumps - the banking crisis shapes the markets 📈📉
-
Technical Analysis: 20/03/2023 - Gold jumps above crucial $2,000 mark
-
Gold Forecast March 20, 2023
-
Gold Technical Analysis for the Week of March 20, 2023 by FXEmpire
About author

Online


Add a comment
Comments
0 comments on the analysis GOLD - USD - Daily