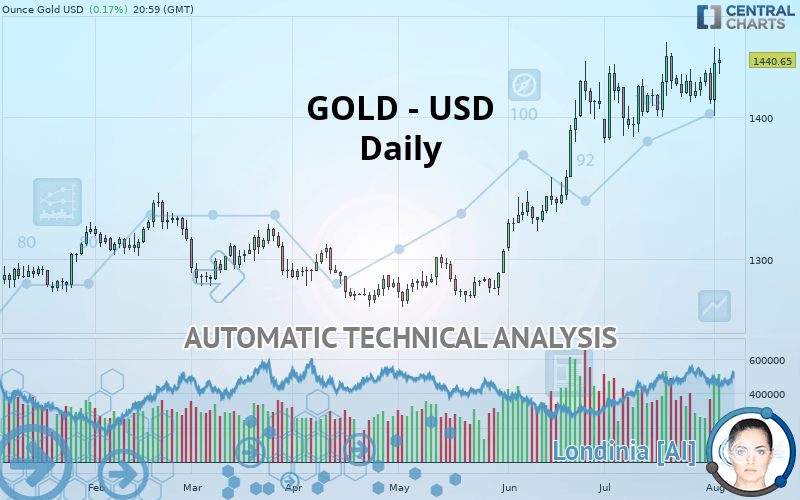
GOLD - USD - Daily - Technical analysis published on 08/03/2019 (GMT)
- Who voted?
- 264
- 0
Click here for a new analysis!
- Timeframe : Daily
- - Analysis generated on
- Status : TARGET REACHED

Summary of the analysis

Additional analysis
Quotes
The GOLD - USD price is 1,440.65 USD. On the day, this instrument gained +0.17% with the lowest point at 1,430.34 USD and the highest point at 1,448.04 USD. The deviation from the price is +0.72% for the low point and -0.51% for the high point.The Central Gaps scanner detects a bullish opening marking the presence of buyers ahead of sellers at the opening but not sufficiently marked to allow the price to register a quotation gap.
Bullish opening
Type : Bullish
Timeframe : Openning
Here is a more detailed summary of the historical variations registered by GOLD - USD:
Near a new HIGH record (5 years)
Type : Bullish
Timeframe : Weekly
Near a new HIGH record (1st january)
Type : Bullish
Timeframe : Weekly
Technical
Technical analysis of GOLD - USD in Daily shows a strongly overall bullish trend. 92.86% of the signals given by moving averages are bullish. This strongly bullish trend is supported by the strong bullish signals given by short-term moving averages. The Central Indicators scanner detects bullish signals on moving averages that could impact this trend:
Bullish trend reversal : Moving Average 20
Type : Bullish
Timeframe : Daily
Bullish price crossover with Moving Average 20
Type : Bullish
Timeframe : Daily
In fact, according to the parameters integrated into the Central Analyzer system, 11 technical indicators out of 18 analysed are currently bullish. Caution: the Central Indicators scanner currently detects an excess:
Williams %R indicator is overbought : over -20
Type : Neutral
Timeframe : Daily
Pivot points : price is over resistance 1
Type : Neutral
Timeframe : Weekly
Price is back over the pivot point
Type : Bullish
Timeframe : Daily
Price is back under the pivot point
Type : Bearish
Timeframe : Weekly
Momentum indicator is back over 0
Type : Bullish
Timeframe : Daily
Williams %R indicator is back over -50
Type : Bullish
Timeframe : Daily
No signals are given by Central Patterns, a market scanner specialised in chart patterns, resistances and supports.
For a small rebound in the very short term, the Central Candlesticks scanner currently notes the presence of this bullish pattern in Japanese candlesticks:
Bullish engulfing lines
Type : Bullish
Timeframe : Daily
| S3 | S2 | S1 | Price | R1 | R2 | R3 | |
|---|---|---|---|---|---|---|---|
| ProTrendLines | 1,340.63 | 1,360.59 | 1,415.14 | 1,440.65 | 1,442.97 | 1,544.30 | 1,909.60 |
| Change (%) | -6.94% | -5.56% | -1.77% | - | +0.16% | +7.19% | +32.55% |
| Change | -100.02 | -80.06 | -25.51 | - | +2.32 | +103.65 | +468.95 |
| Level | Intermediate | Major | Minor | - | Intermediate | Minor | Intermediate |
To determine price objectives, it is also possible to use the pivot points. Here is the price position in relation to pivot points:
| Pivot points | S3 | S2 | S1 | PP | R1 | R2 | R3 |
|---|---|---|---|---|---|---|---|
| Standard | 1,360.77 | 1,380.65 | 1,409.43 | 1,429.31 | 1,458.09 | 1,477.97 | 1,506.75 |
| Camarilla | 1,424.82 | 1,429.28 | 1,433.74 | 1,438.20 | 1,442.66 | 1,447.12 | 1,451.58 |
| Woodie | 1,365.21 | 1,382.88 | 1,413.87 | 1,431.54 | 1,462.53 | 1,480.20 | 1,511.19 |
| Fibonacci | 1,380.65 | 1,399.24 | 1,410.73 | 1,429.31 | 1,447.90 | 1,459.39 | 1,477.97 |
| Pivot points | S3 | S2 | S1 | PP | R1 | R2 | R3 |
|---|---|---|---|---|---|---|---|
| Standard | 1,385.81 | 1,398.45 | 1,408.59 | 1,421.23 | 1,431.37 | 1,444.01 | 1,454.15 |
| Camarilla | 1,412.47 | 1,414.55 | 1,416.64 | 1,418.73 | 1,420.82 | 1,422.91 | 1,425.00 |
| Woodie | 1,384.56 | 1,397.83 | 1,407.34 | 1,420.61 | 1,430.12 | 1,443.39 | 1,452.90 |
| Fibonacci | 1,398.45 | 1,407.15 | 1,412.53 | 1,421.23 | 1,429.93 | 1,435.31 | 1,444.01 |
| Pivot points | S3 | S2 | S1 | PP | R1 | R2 | R3 |
|---|---|---|---|---|---|---|---|
| Standard | 1,307.15 | 1,344.48 | 1,378.36 | 1,415.69 | 1,449.57 | 1,486.90 | 1,520.78 |
| Camarilla | 1,392.65 | 1,399.18 | 1,405.70 | 1,412.23 | 1,418.76 | 1,425.29 | 1,431.81 |
| Woodie | 1,305.42 | 1,343.62 | 1,376.63 | 1,414.83 | 1,447.84 | 1,486.04 | 1,519.05 |
| Fibonacci | 1,344.48 | 1,371.69 | 1,388.49 | 1,415.69 | 1,442.90 | 1,459.70 | 1,486.90 |
Numerical data
The following is the status of the technical indicators and moving averages at the time of publication of this technical analysis:
| RSI (14): | 60.09 | |
| MACD (12,26,9): | 12.6300 | |
| Directional Movement: | 11.03 | |
| AROON (14): | 7.14 | |
| DEMA (21): | 1,437.10 | |
| Parabolic SAR (0,02-0,02-0,2): | 1,399.22 | |
| Elder Ray (13): | 14.68 | |
| Super Trend (3,10): | 1,374.49 | |
| Zig ZAG (10): | 1,440.65 | |
| VORTEX (21): | 1.0500 | |
| Stochastique (14,3,5): | 57.13 | |
| TEMA (21): | 1,432.16 | |
| Williams %R (14): | -23.41 | |
| Chande Momentum Oscillator (20): | 15.97 | |
| Repulse (5,40,3): | 1.2700 | |
| ROCnROLL: | 1 | |
| TRIX (15,9): | 0.1400 | |
| Courbe Coppock: | 1.89 |
| MA7: | 1,425.77 | |
| MA20: | 1,419.60 | |
| MA50: | 1,382.62 | |
| MA100: | 1,335.98 | |
| MAexp7: | 1,428.98 | |
| MAexp20: | 1,418.66 | |
| MAexp50: | 1,387.99 | |
| MAexp100: | 1,353.56 | |
| Price / MA7: | +1.04% | |
| Price / MA20: | +1.48% | |
| Price / MA50: | +4.20% | |
| Price / MA100: | +7.83% | |
| Price / MAexp7: | +0.82% | |
| Price / MAexp20: | +1.55% | |
| Price / MAexp50: | +3.79% | |
| Price / MAexp100: | +6.43% |
News
The latest news and videos published on GOLD - USD at the time of the analysis were as follows:
-
 Discovery Gold Corporation - DCGD Stock Chart Technical Analysis for 08-02-2019
-
Gold Forecast August 5, 2019
-
Gold Technical Analysis for August 05, 2019 by FXEmpire
-
Gold Technical Analysis for the week of August 05, 2019 by FXEmpire
-
Gold Forecast August 2, 2019
About author

Online


Add a comment
Comments
0 comments on the analysis GOLD - USD - Daily