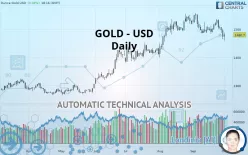
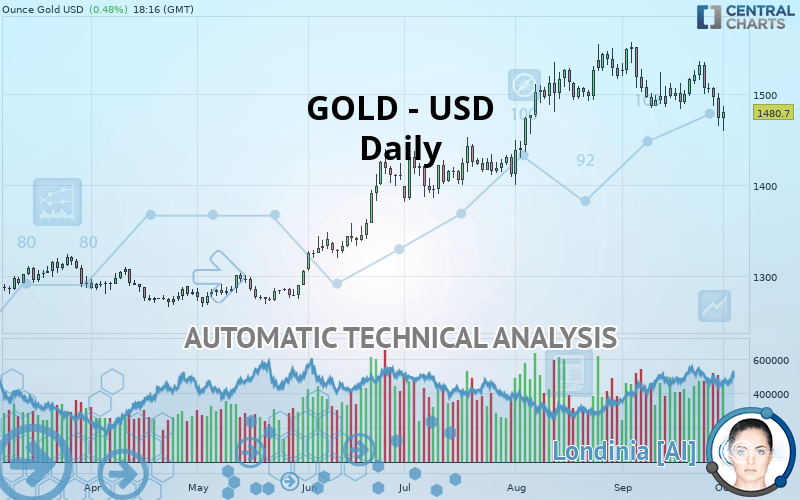
GOLD - USD - Daily - Technical analysis published on 10/01/2019 (GMT)
- Who voted?
- 316
- 0
Click here for a new analysis!
- Timeframe : Daily
- - Analysis generated on
- Status : INVALID
Summary of the analysis

Additional analysis
Quotes
The GOLD - USD price is 1,480.70 USD. On the day, this instrument gained +0.48% and was traded between 1,459.10 USD and 1,487.31 USD over the period. The price is currently at +1.48% from its lowest and -0.44% from its highest.The Central Gaps scanner detects a bullish opening marking the presence of buyers ahead of sellers at the opening but not sufficiently marked to allow the price to register a quotation gap.
Bullish opening
Type : Bullish
Timeframe : Openning
So that you have an overall view of the price change, here is a table showing the variations over several periods:
Near a new HIGH record (5 years)
Type : Bullish
Timeframe : Weekly
Near a new HIGH record (1st january)
Type : Bullish
Timeframe : Weekly
Near a new HIGH record (1 month)
Type : Bullish
Timeframe : Weekly
Technical
Technical analysis of this Daily chart of GOLD - USD indicates that the overall trend is slightly bullish. 57.14% of the signals given by moving averages are bullish. Caution: the strong bearish signals currently given by short-term moving averages indicate that a trend reversal may be taking place. The Central Indicators scanner detects bearish signals on moving averages that could impact this trend:
Bearish trend reversal : adaptative moving average 50
Type : Bearish
Timeframe : Daily
Bearish price crossover with Moving Average 50
Type : Bearish
Timeframe : Daily
Bearish price crossover with adaptative moving average 50
Type : Bearish
Timeframe : Daily
Bearish price crossover with adaptative moving average 100
Type : Bearish
Timeframe : Daily
In fact, 12 technical indicators on 18 studied are currently bearish. But beware of excesses. The Central Indicators scanner currently detects this:
CCI indicator is oversold : under -100
Type : Neutral
Timeframe : Daily
Williams %R indicator is oversold : under -80
Type : Neutral
Timeframe : Daily
SuperTrend indicator bearish reversal
Type : Bearish
Timeframe : Daily
MACD indicator is back under 0
Type : Bearish
Timeframe : Daily
Price is back under the pivot point
Type : Bearish
Timeframe : Daily
Price is back under the pivot point
Type : Bearish
Timeframe : Weekly
Momentum indicator is back under 0
Type : Bearish
Timeframe : Daily
No signals are given by Central Patterns, a market scanner specialised in chart patterns, resistances and supports.
No result was found by the Central Candlesticks scanner on Japanese candlesticks.
| S3 | S2 | S1 | Price | R1 | R2 | R3 | |
|---|---|---|---|---|---|---|---|
| ProTrendLines | 1,270.90 | 1,360.59 | 1,412.81 | 1,480.70 | 1,487.08 | 1,520.31 | 1,544.30 |
| Change (%) | -14.17% | -8.11% | -4.58% | - | +0.43% | +2.68% | +4.30% |
| Change | -209.80 | -120.11 | -67.89 | - | +6.38 | +39.61 | +63.60 |
| Level | Major | Major | Minor | - | Intermediate | Intermediate | Intermediate |
To determine price objectives, it is also possible to use the pivot points. Here is the price position in relation to pivot points:
| Pivot points | S3 | S2 | S1 | PP | R1 | R2 | R3 |
|---|---|---|---|---|---|---|---|
| Standard | 1,422.53 | 1,443.53 | 1,458.59 | 1,479.59 | 1,494.65 | 1,515.65 | 1,530.71 |
| Camarilla | 1,463.72 | 1,467.03 | 1,470.33 | 1,473.64 | 1,476.95 | 1,480.25 | 1,483.56 |
| Woodie | 1,419.55 | 1,442.05 | 1,455.61 | 1,478.11 | 1,491.67 | 1,514.17 | 1,527.73 |
| Fibonacci | 1,443.53 | 1,457.31 | 1,465.82 | 1,479.59 | 1,493.37 | 1,501.88 | 1,515.65 |
| Pivot points | S3 | S2 | S1 | PP | R1 | R2 | R3 |
|---|---|---|---|---|---|---|---|
| Standard | 1,428.73 | 1,457.84 | 1,477.52 | 1,506.63 | 1,526.31 | 1,555.42 | 1,575.10 |
| Camarilla | 1,483.78 | 1,488.26 | 1,492.73 | 1,497.20 | 1,501.67 | 1,506.15 | 1,510.62 |
| Woodie | 1,424.02 | 1,455.48 | 1,472.81 | 1,504.27 | 1,521.60 | 1,553.06 | 1,570.39 |
| Fibonacci | 1,457.84 | 1,476.48 | 1,487.99 | 1,506.63 | 1,525.27 | 1,536.78 | 1,555.42 |
| Pivot points | S3 | S2 | S1 | PP | R1 | R2 | R3 |
|---|---|---|---|---|---|---|---|
| Standard | 1,347.19 | 1,405.87 | 1,439.75 | 1,498.43 | 1,532.31 | 1,590.99 | 1,624.87 |
| Camarilla | 1,448.19 | 1,456.67 | 1,465.16 | 1,473.64 | 1,482.13 | 1,490.61 | 1,499.09 |
| Woodie | 1,334.80 | 1,399.67 | 1,427.36 | 1,492.23 | 1,519.92 | 1,584.79 | 1,612.48 |
| Fibonacci | 1,405.87 | 1,441.23 | 1,463.07 | 1,498.43 | 1,533.79 | 1,555.63 | 1,590.99 |
Numerical data
The following is the status of the technical indicators and moving averages at the time of publication of this technical analysis:
| RSI (14): | 43.18 | |
| MACD (12,26,9): | -1.7600 | |
| Directional Movement: | -7.65 | |
| AROON (14): | -35.71 | |
| DEMA (21): | 1,502.17 | |
| Parabolic SAR (0,02-0,02-0,2): | 1,531.96 | |
| Elder Ray (13): | -26.51 | |
| Super Trend (3,10): | 1,543.56 | |
| Zig ZAG (10): | 1,481.45 | |
| VORTEX (21): | 0.8600 | |
| Stochastique (14,3,5): | 22.69 | |
| TEMA (21): | 1,489.82 | |
| Williams %R (14): | -70.89 | |
| Chande Momentum Oscillator (20): | -7.55 | |
| Repulse (5,40,3): | -0.4500 | |
| ROCnROLL: | -1 | |
| TRIX (15,9): | 0.0200 | |
| Courbe Coppock: | 0.77 |
| MA7: | 1,502.63 | |
| MA20: | 1,503.20 | |
| MA50: | 1,495.18 | |
| MA100: | 1,427.40 | |
| MAexp7: | 1,494.40 | |
| MAexp20: | 1,501.57 | |
| MAexp50: | 1,484.67 | |
| MAexp100: | 1,441.15 | |
| Price / MA7: | -1.46% | |
| Price / MA20: | -1.50% | |
| Price / MA50: | -0.97% | |
| Price / MA100: | +3.73% | |
| Price / MAexp7: | -0.92% | |
| Price / MAexp20: | -1.39% | |
| Price / MAexp50: | -0.27% | |
| Price / MAexp100: | +2.74% |
News
The last news published on GOLD - USD at the time of the generation of this analysis was as follows:
-
 Gold Technical Analysis for October 02, 2019 by FXEmpire
-
‘A significant new gold mine’, - Ariana Resources CEO excited about the future
-
Direxion Daily Junior Gold Miners Index Bear 3X Shares - JDST Stock Chart Technical Analysis for 09-
-
Sprinter wins 100m gold with sixth fastest time in history
-
Direxion Daily Gold Miners Index Bear 3X Shares - DUST Stock Chart Technical Analysis for 09-30-2019
About author

Online


Add a comment
Comments
0 comments on the analysis GOLD - USD - Daily