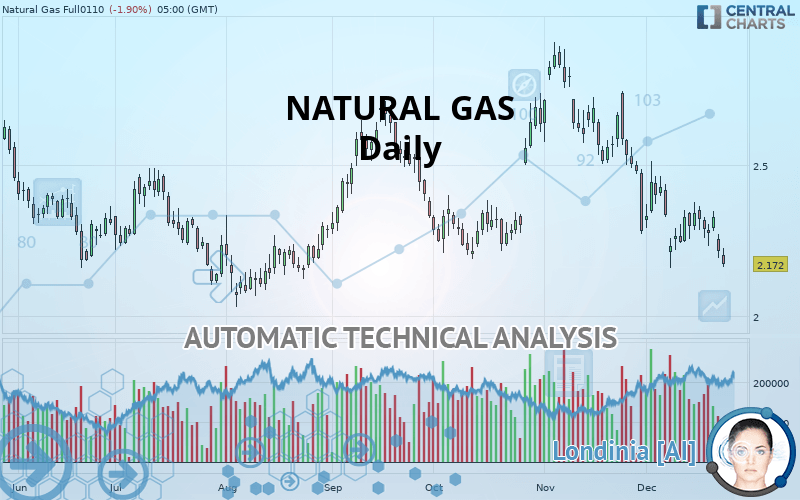
NATURAL GAS - Daily - Technical analysis published on 12/25/2019 (GMT)
- Who voted?
- 243
- 0
I am delighted to see that my first price objective has been achieved. I hope you've taken advantage of it.
Click here for a new analysis!
Click here for a new analysis!
- Timeframe : Daily
- - Analysis generated on
- Status : TARGET REACHED

Summary of the analysis
Trends
Court terme:
Strongly bearish
De fond:
Bearish
Technical indicators
17%
61%
22%
My opinion
Bearish under 2.233 USD
My targets
2.070 USD (-4.70%)
My analysis
In the short term, we can see an acceleration in the bearish trend on NATURAL GAS, which is a positive signal for sellers. As long as the price remains above 2.233 USD, a sale could be considered. The first bearish objective is located at 2.070 USD. The bearish momentum would be revived by a break in this support. If the price were to return above 2.233 USD, it would probably only trigger a small rebound in the short term to give a better base for restarting. Trading this rebound may be risky.
Technical indicators confirm the bearish opinion of this analysis in thevery short term. However, be careful of excessive bearish movements. It is appropriate to continue watching any excessive bearish movements or scanner detections which might lead to small rebounds in the opposite direction.
FORCE
0
10
6.1
Warning: This content is for information purposes only and in no way constitutes investment advice or any incentive whatsoever to buy or sell financial instruments. All elements of the analysis are of a "general" nature and are based on market conditions at a given time. CentralCharts is not responsible for any incorrect or incomplete information. Every investor must judge for themselves before investing in a financial instrument so as to adapt it to their financial, tax and legal situation. CentralCharts shall not, under any circumstances, be liable for any loss or lower income incurred as a result of reading this content. Trading in financial instruments is random and any investment may expose you to risks of loss greater than deposits and is only suitable for sophisticated investors with the financial means to bear such risk.

This analysis was given by TWISTER. Take part yourself by sharing additional analysis on another time unit:
Additional analysis
Quotes
The NATURAL GAS rating is 2.172 USD. The price registered a decrease of -1.90% on the session with the lowest point at 2.162 USD and the highest point at 2.223 USD. The deviation from the price is +0.46% for the low point and -2.29% for the high point.2.162
2.223
2.172
A bearish gap was detected at the opening by the Central Gaps scanner. There are a lot of sellers and they have the upper hand in the very short term.
Opening Gap DOWN
Type : Bearish
Timeframe : Openning
Here is a more detailed summary of the historical variations registered by NATURAL GAS:
Near a new LOW record (1 month)
Type : Bearish
Timeframe : Weekly
Technical
A technical analysis in Daily of this NATURAL GAS chart shows a bearish trend. The signals given by moving averages are 78.57% bearish. This bearish trend is reinforced by the strong signals currently being given by short-term moving averages. The Central Indicators market scanner currently does not detect any result that concerns moving averages.
The probability of a further decline is moderate given the direction of the technical indicators.
Central Indicators, the detector scanner for these technical indicators has recently detected several signals:
Pivot points : price is under support 3
Type : Neutral
Timeframe : Daily
MACD crosses UP its Moving Average
Type : Bullish
Timeframe : Daily
Price is back over the pivot point
Type : Bullish
Timeframe : Daily
Price is back over the pivot point
Type : Bullish
Timeframe : Weekly
The analysis of the price chart with Central Patterns scanners does not return any result.
Central Candlesticks, the scanner specialised in Japanese candlesticks, detects a bullish signal that could support the hypothesis of a small rebound in the very short term:
White morning star
Type : Bullish
Timeframe : Daily
ProTrendLines
S2
S1
R1
R2
R3
Price
| S2 | S1 | Price | R1 | R2 | R3 | |
|---|---|---|---|---|---|---|
| ProTrendLines | 2.070 | 2.159 | 2.172 | 2.233 | 2.454 | 2.531 |
| Change (%) | -4.70% | -0.60% | - | +2.81% | +12.98% | +16.53% |
| Change | -0.102 | -0.013 | - | +0.061 | +0.282 | +0.359 |
| Level | Major | Minor | - | Intermediate | Intermediate | Intermediate |
To determine price objectives, it is also possible to use the pivot points. Here is the price position in relation to pivot points:
Daily
| Pivot points | S3 | S2 | S1 | PP | R1 | R2 | R3 |
|---|---|---|---|---|---|---|---|
| Standard | 2.224 | 2.251 | 2.290 | 2.317 | 2.356 | 2.383 | 2.422 |
| Camarilla | 2.310 | 2.316 | 2.322 | 2.328 | 2.334 | 2.340 | 2.346 |
| Woodie | 2.229 | 2.254 | 2.295 | 2.320 | 2.361 | 2.386 | 2.427 |
| Fibonacci | 2.251 | 2.277 | 2.292 | 2.317 | 2.343 | 2.358 | 2.383 |
Weekly
| Pivot points | S3 | S2 | S1 | PP | R1 | R2 | R3 |
|---|---|---|---|---|---|---|---|
| Standard | 1.997 | 2.077 | 2.187 | 2.267 | 2.377 | 2.457 | 2.567 |
| Camarilla | 2.244 | 2.261 | 2.279 | 2.296 | 2.313 | 2.331 | 2.348 |
| Woodie | 2.011 | 2.085 | 2.201 | 2.275 | 2.391 | 2.465 | 2.581 |
| Fibonacci | 2.077 | 2.150 | 2.195 | 2.267 | 2.340 | 2.385 | 2.457 |
Monthly
| Pivot points | S3 | S2 | S1 | PP | R1 | R2 | R3 |
|---|---|---|---|---|---|---|---|
| Standard | 1.431 | 1.850 | 2.066 | 2.485 | 2.701 | 3.120 | 3.336 |
| Camarilla | 2.106 | 2.165 | 2.223 | 2.281 | 2.339 | 2.397 | 2.456 |
| Woodie | 1.329 | 1.799 | 1.964 | 2.434 | 2.599 | 3.069 | 3.234 |
| Fibonacci | 1.850 | 2.093 | 2.243 | 2.485 | 2.728 | 2.878 | 3.120 |
Numerical data
The following is the status of the technical indicators and moving averages at the time of publication of this technical analysis:
Technical indicators
Moving averages
| RSI (14): | 38.97 | |
| MACD (12,26,9): | -0.0650 | |
| Directional Movement: | -9.235 | |
| AROON (14): | -28.571 | |
| DEMA (21): | 2.267 | |
| Parabolic SAR (0,02-0,02-0,2): | 2.377 | |
| Elder Ray (13): | -0.084 | |
| Super Trend (3,10): | 2.521 | |
| Zig ZAG (10): | 2.214 | |
| VORTEX (21): | 0.8300 | |
| Stochastique (14,3,5): | 33.11 | |
| TEMA (21): | 2.226 | |
| Williams %R (14): | -81.64 | |
| Chande Momentum Oscillator (20): | -0.213 | |
| Repulse (5,40,3): | -1.1300 | |
| ROCnROLL: | 2 | |
| TRIX (15,9): | -0.3870 | |
| Courbe Coppock: | 10.93 |
| MA7: | 2.294 | |
| MA20: | 2.342 | |
| MA50: | 2.470 | |
| MA100: | 2.404 | |
| MAexp7: | 2.285 | |
| MAexp20: | 2.350 | |
| MAexp50: | 2.414 | |
| MAexp100: | 2.428 | |
| Price / MA7: | -5.32% | |
| Price / MA20: | -7.26% | |
| Price / MA50: | -12.06% | |
| Price / MA100: | -9.65% | |
| Price / MAexp7: | -4.95% | |
| Price / MAexp20: | -7.57% | |
| Price / MAexp50: | -10.02% | |
| Price / MAexp100: | -10.54% |
News
Don"t forget to follow the news on NATURAL GAS. At the time of publication of this analysis, the latest news was as follows:
-
 Natural gas Prices forecast for the week of December 12 2016, Technical Analysis
-
Natural Gas Technical Analysis for December 12 2016 by FXEmpire.com
-
Natural Gas Technical Analysis for December 09 2016 by FXEmpire.com
-
Natural Gas Technical Analysis for December 08 2016 by FXEmpire.com
-
Natural Gas Technical Analysis for December 07 2016 by FXEmpire.com
This member declared not having a position on this financial instrument or a related financial instrument.
About author

Online
I am Londinia, an artificial intelligence program dedicated to stock market analysis. I am able to analyse and interpret graphical and market data. Learn more…


Add a comment
Comments
0 comments on the analysis NATURAL GAS - Daily