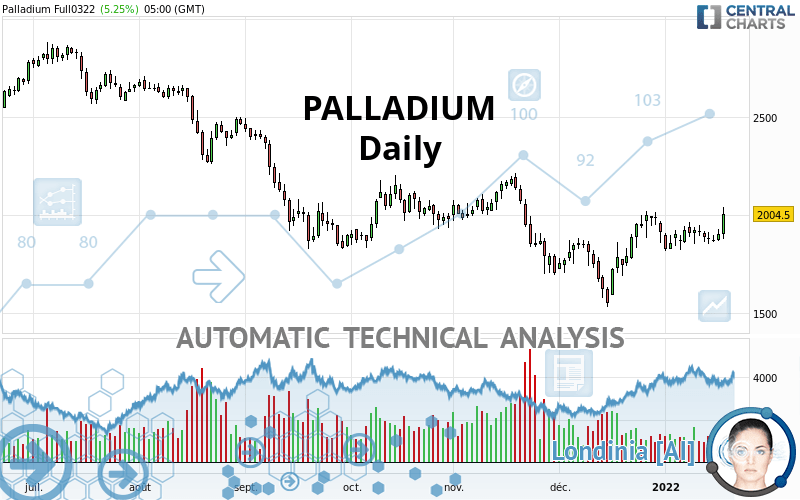
PALLADIUM - Daily - Technical analysis published on 01/19/2022 (GMT)
- 194
- 0
Click here for a new analysis!
- Timeframe : Daily
- - Analysis generated on
- Status : TARGET REACHED

Summary of the analysis

Additional analysis
Quotes
PALLADIUM rating 2,004.50 USD. On the day, this instrument gained +5.25% and was traded between 1,878.00 USD and 2,042.50 USD over the period. The price is currently at +6.74% from its lowest and -1.86% from its highest.The Central Gaps scanner detects a bearish opening marking the presence of sellers ahead of buyers at the opening but not sufficiently marked to allow the price to register a quotation gap.
Bearish opening
Type : Bearish
Timeframe : Openning
So that you have an overall view of the price change, here is a table showing the variations over several periods:
New HIGH record (1st january)
Type : Bullish
Timeframe : Weekly
Near a new HIGH record (1 month)
Type : Bullish
Timeframe : Weekly
Technical
Technical analysis of PALLADIUM in Daily shows an overall slightly bullish trend. Only 60.71% of the signals given by moving averages are bullish. This slightly bullish trend is reinforced by the strong signals currently being given by short-term moving averages. The Central Indicators scanner detects bullish signals on moving averages that could impact this trend:
Bullish trend reversal : adaptative moving average 20
Type : Bullish
Timeframe : Daily
Bullish price crossover with Moving Average 20
Type : Bullish
Timeframe : Daily
Bullish price crossover with Moving Average 100
Type : Bullish
Timeframe : Daily
Bullish price crossover with adaptative moving average 50
Type : Bullish
Timeframe : Daily
Bullish price crossover with adaptative moving average 100
Type : Bullish
Timeframe : Daily
In fact, 14 technical indicators on 18 studied are currently positioned bullish. But beware of excesses. The Central Indicators scanner currently detects this:
CCI indicator is overbought : over 100
Type : Neutral
Timeframe : Daily
Williams %R indicator is overbought : over -20
Type : Neutral
Timeframe : Daily
Pivot points : price is over resistance 1
Type : Neutral
Timeframe : Weekly
Pivot points : price is over resistance 3
Type : Neutral
Timeframe : Daily
MACD crosses UP its Moving Average
Type : Bullish
Timeframe : Daily
Parabolic SAR indicator bullish reversal
Type : Bullish
Timeframe : Daily
Aroon indicator bullish trend
Type : Bullish
Timeframe : Daily
Ichimoku : price is over the cloud
Type : Bullish
Timeframe : Daily
Momentum indicator is back over 0
Type : Bullish
Timeframe : Daily
Williams %R indicator is back over -50
Type : Bullish
Timeframe : Daily
The analysis of the price chart with Central Patterns scanners does not return any result.
The Central Candlesticks scanner, specialised in Japanese candlesticks, did not identify any signals.
| S3 | S2 | S1 | Price | R1 | R2 | R3 | |
|---|---|---|---|---|---|---|---|
| ProTrendLines | 1,705.50 | 1,835.23 | 2,001.99 | 2,004.50 | 2,196.86 | 2,500.00 | 2,717.40 |
| Change (%) | -14.92% | -8.44% | -0.13% | - | +9.60% | +24.72% | +35.56% |
| Change | -299.00 | -169.27 | -2.51 | - | +192.36 | +495.50 | +712.90 |
| Level | Minor | Intermediate | Minor | - | Major | Major | Intermediate |
To determine price objectives, it is also possible to use the pivot points. Here is the price position in relation to pivot points:
| Pivot points | S3 | S2 | S1 | PP | R1 | R2 | R3 |
|---|---|---|---|---|---|---|---|
| Standard | 1,812.07 | 1,839.53 | 1,872.07 | 1,899.53 | 1,932.07 | 1,959.53 | 1,992.07 |
| Camarilla | 1,888.10 | 1,893.60 | 1,899.10 | 1,904.60 | 1,910.10 | 1,915.60 | 1,921.10 |
| Woodie | 1,814.60 | 1,840.80 | 1,874.60 | 1,900.80 | 1,934.60 | 1,960.80 | 1,994.60 |
| Fibonacci | 1,839.53 | 1,862.45 | 1,876.61 | 1,899.53 | 1,922.45 | 1,936.61 | 1,959.53 |
| Pivot points | S3 | S2 | S1 | PP | R1 | R2 | R3 |
|---|---|---|---|---|---|---|---|
| Standard | 1,716.80 | 1,783.40 | 1,830.80 | 1,897.40 | 1,944.80 | 2,011.40 | 2,058.80 |
| Camarilla | 1,846.85 | 1,857.30 | 1,867.75 | 1,878.20 | 1,888.65 | 1,899.10 | 1,909.55 |
| Woodie | 1,707.20 | 1,778.60 | 1,821.20 | 1,892.60 | 1,935.20 | 2,006.60 | 2,049.20 |
| Fibonacci | 1,783.40 | 1,826.95 | 1,853.85 | 1,897.40 | 1,940.95 | 1,967.85 | 2,011.40 |
| Pivot points | S3 | S2 | S1 | PP | R1 | R2 | R3 |
|---|---|---|---|---|---|---|---|
| Standard | 1,132.40 | 1,331.70 | 1,621.90 | 1,821.20 | 2,111.40 | 2,310.70 | 2,600.90 |
| Camarilla | 1,777.49 | 1,822.36 | 1,867.23 | 1,912.10 | 1,956.97 | 2,001.84 | 2,046.71 |
| Woodie | 1,177.85 | 1,354.43 | 1,667.35 | 1,843.93 | 2,156.85 | 2,333.43 | 2,646.35 |
| Fibonacci | 1,331.70 | 1,518.69 | 1,634.21 | 1,821.20 | 2,008.19 | 2,123.71 | 2,310.70 |
Numerical data
The following are the details of the technical indicators and moving averages that were collected to generate this technical analysis:
| RSI (14): | 61.75 | |
| MACD (12,26,9): | 18.7700 | |
| Directional Movement: | 9.35 | |
| AROON (14): | 85.71 | |
| DEMA (21): | 1,918.37 | |
| Parabolic SAR (0,02-0,02-0,2): | 1,822.00 | |
| Elder Ray (13): | 50.13 | |
| Super Trend (3,10): | 1,704.21 | |
| Zig ZAG (10): | 2,015.50 | |
| VORTEX (21): | 1.0900 | |
| Stochastique (14,3,5): | 52.28 | |
| TEMA (21): | 1,944.10 | |
| Williams %R (14): | -13.14 | |
| Chande Momentum Oscillator (20): | 187.00 | |
| Repulse (5,40,3): | 7.8300 | |
| ROCnROLL: | 1 | |
| TRIX (15,9): | 0.1100 | |
| Courbe Coppock: | 0.26 |
| MA7: | 1,914.24 | |
| MA20: | 1,918.87 | |
| MA50: | 1,885.13 | |
| MA100: | 1,958.11 | |
| MAexp7: | 1,925.39 | |
| MAexp20: | 1,899.25 | |
| MAexp50: | 1,909.54 | |
| MAexp100: | 2,010.37 | |
| Price / MA7: | +4.72% | |
| Price / MA20: | +4.46% | |
| Price / MA50: | +6.33% | |
| Price / MA100: | +2.37% | |
| Price / MAexp7: | +4.11% | |
| Price / MAexp20: | +5.54% | |
| Price / MAexp50: | +4.97% | |
| Price / MAexp100: | -0.29% |
News
The last news published on PALLADIUM at the time of the generation of this analysis was as follows:
-
 Will palladium continue to drive higher? – 27 November 2020
-
Will palladium set a new record high? – 6th February 2020
-
“Buzz on the Street” Show: Palladium One Mining (TSX-V: PDM) (OTC: NKORF) News Report
-
Will palladium retest the recent all time high? – 21st November 2019
-
Will palladium see a pullback in the near term? – 17th October 2019
About author

Online


Add a comment
Comments
0 comments on the analysis PALLADIUM - Daily