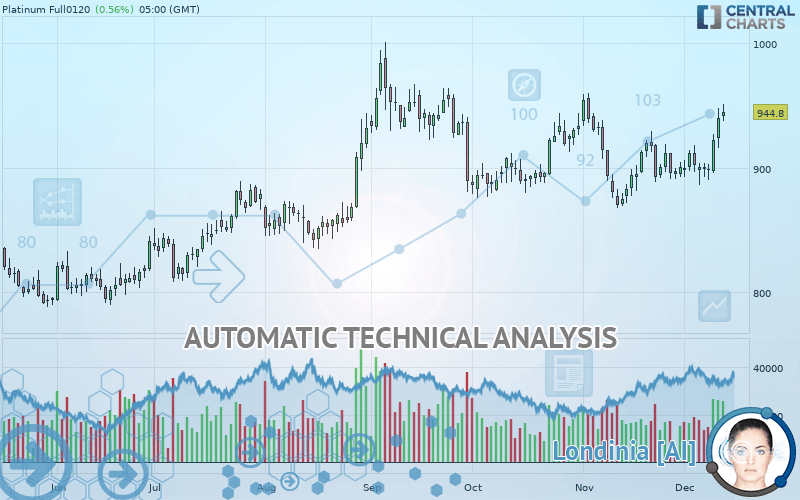
PLATINUM - Daily - Technical analysis published on 12/13/2019 (GMT)
- Who voted?
- 269
- 0
Click here for a new analysis!
- Timeframe : Daily
- - Analysis generated on
- Status : TARGET REACHED
Summary of the analysis

Additional analysis
Quotes
The PLATINUM price is 944.80 USD. The price has increased by +0.56% since the last closing and was traded between 937.30 USD and 951.40 USD over the period. The price is currently at +0.80% from its lowest and -0.69% from its highest.The Central Gaps scanner detects a bullish opening. A small advantage for buyers in the very short term.
Bullish opening
Type : Bullish
Timeframe : Openning
A study of price movements over other periods shows the following variations:
Technical
Technical analysis of this Daily chart of PLATINUM indicates that the overall trend is strongly bullish. The signals given by the moving averages are 89.29% bullish. This strong bullish trend is confirmed by the strong signals currently being given by short-term moving averages. An assessment of moving averages reveals several bullish signals that could impact this trend:
Bullish trend reversal : adaptative moving average 20
Type : Bullish
Timeframe : Daily
Bullish trend reversal : adaptative moving average 50
Type : Bullish
Timeframe : Daily
Bullish price crossover with Moving Average 20
Type : Bullish
Timeframe : Daily
Bullish price crossover with Moving Average 50
Type : Bullish
Timeframe : Daily
Bullish price crossover with Moving Average 100
Type : Bullish
Timeframe : Daily
Bullish price crossover with adaptative moving average 20
Type : Bullish
Timeframe : Daily
Bullish price crossover with adaptative moving average 50
Type : Bullish
Timeframe : Daily
The probability of a further increase is high given the direction of the technical indicators.
Caution: the Central Indicators scanner currently detects an excess:
CCI indicator is overbought : over 100
Type : Neutral
Timeframe : Daily
Williams %R indicator is overbought : over -20
Type : Neutral
Timeframe : Daily
Pivot points : price is over resistance 1
Type : Neutral
Timeframe : Daily
RSI indicator is back over 50
Type : Bullish
Timeframe : Daily
Ichimoku - Bullish crossover : Tenkan & Kijun
Type : Bullish
Timeframe : Daily
Momentum indicator is back over 0
Type : Bullish
Timeframe : Daily
Williams %R indicator is back over -50
Type : Bullish
Timeframe : Daily
No signals are given by Central Patterns, a market scanner specialised in chart patterns, resistances and supports.
The presence of a bullish Japanese candlestick pattern detected by Central Candlesticks that could cause a very short term rebound was also detected:
Bullish engulfing lines
Type : Bullish
Timeframe : Daily
| S3 | S2 | S1 | Price | R1 | R2 | R3 | |
|---|---|---|---|---|---|---|---|
| ProTrendLines | 842.00 | 899.61 | 919.89 | 944.80 | 954.47 | 984.20 | 1,031.25 |
| Change (%) | -10.88% | -4.78% | -2.64% | - | +1.02% | +4.17% | +9.15% |
| Change | -102.80 | -45.19 | -24.91 | - | +9.67 | +39.40 | +86.45 |
| Level | Intermediate | Major | Intermediate | - | Major | Minor | Intermediate |
Pivot points can also be used to set your price objectives. Here is the price situation in relation to pivot points:
| Pivot points | S3 | S2 | S1 | PP | R1 | R2 | R3 |
|---|---|---|---|---|---|---|---|
| Standard | 872.30 | 884.00 | 903.30 | 915.00 | 934.30 | 946.00 | 965.30 |
| Camarilla | 914.08 | 916.92 | 919.76 | 922.60 | 925.44 | 928.28 | 931.13 |
| Woodie | 876.10 | 885.90 | 907.10 | 916.90 | 938.10 | 947.90 | 969.10 |
| Fibonacci | 884.00 | 895.84 | 903.16 | 915.00 | 926.84 | 934.16 | 946.00 |
| Pivot points | S3 | S2 | S1 | PP | R1 | R2 | R3 |
|---|---|---|---|---|---|---|---|
| Standard | 859.93 | 875.47 | 887.93 | 903.47 | 915.93 | 931.47 | 943.93 |
| Camarilla | 892.70 | 895.27 | 897.83 | 900.40 | 902.97 | 905.53 | 908.10 |
| Woodie | 858.40 | 874.70 | 886.40 | 902.70 | 914.40 | 930.70 | 942.40 |
| Fibonacci | 875.47 | 886.16 | 892.77 | 903.47 | 914.16 | 920.77 | 931.47 |
| Pivot points | S3 | S2 | S1 | PP | R1 | R2 | R3 |
|---|---|---|---|---|---|---|---|
| Standard | 766.73 | 817.27 | 858.83 | 909.37 | 950.93 | 1,001.47 | 1,043.03 |
| Camarilla | 875.07 | 883.52 | 891.96 | 900.40 | 908.84 | 917.29 | 925.73 |
| Woodie | 762.25 | 815.03 | 854.35 | 907.13 | 946.45 | 999.23 | 1,038.55 |
| Fibonacci | 817.27 | 852.45 | 874.18 | 909.37 | 944.55 | 966.28 | 1,001.47 |
Numerical data
The following is the status of the technical indicators and moving averages at the time of publication of this technical analysis:
| RSI (14): | 63.30 | |
| MACD (12,26,9): | 2.5900 | |
| Directional Movement: | 18.29 | |
| AROON (14): | 28.57 | |
| DEMA (21): | 909.51 | |
| Parabolic SAR (0,02-0,02-0,2): | 886.40 | |
| Elder Ray (13): | 22.17 | |
| Super Trend (3,10): | 873.88 | |
| Zig ZAG (10): | 939.50 | |
| VORTEX (21): | 1.1200 | |
| Stochastique (14,3,5): | 66.15 | |
| TEMA (21): | 913.52 | |
| Williams %R (14): | -13.09 | |
| Chande Momentum Oscillator (20): | 39.10 | |
| Repulse (5,40,3): | 4.8300 | |
| ROCnROLL: | 1 | |
| TRIX (15,9): | -0.0200 | |
| Courbe Coppock: | 1.91 |
| MA7: | 910.50 | |
| MA20: | 904.54 | |
| MA50: | 905.77 | |
| MA100: | 903.24 | |
| MAexp7: | 914.50 | |
| MAexp20: | 907.76 | |
| MAexp50: | 906.22 | |
| MAexp100: | 897.01 | |
| Price / MA7: | +3.77% | |
| Price / MA20: | +4.45% | |
| Price / MA50: | +4.31% | |
| Price / MA100: | +4.60% | |
| Price / MAexp7: | +3.31% | |
| Price / MAexp20: | +4.08% | |
| Price / MAexp50: | +4.26% | |
| Price / MAexp100: | +5.33% |
News
The last news published on PLATINUM at the time of the generation of this analysis was as follows:
-
 Platinum Group Metals Ltd. - PLG Stock Chart Technical Analysis for 08-30-2019
-
Gold Recently Posted New 2019 Highs, While Silver And Platinum Languish
-
Will platinum break higher? – 28th February 2019
-
Choose Platinum Over White Gold For Your Engagement Ring, says A Bespoke Jeweller.
-
Platinum Group Metals Ltd. - PLG Stock Chart Technical Analysis for 10-25-18
About author

Online


Add a comment
Comments
0 comments on the analysis PLATINUM - Daily