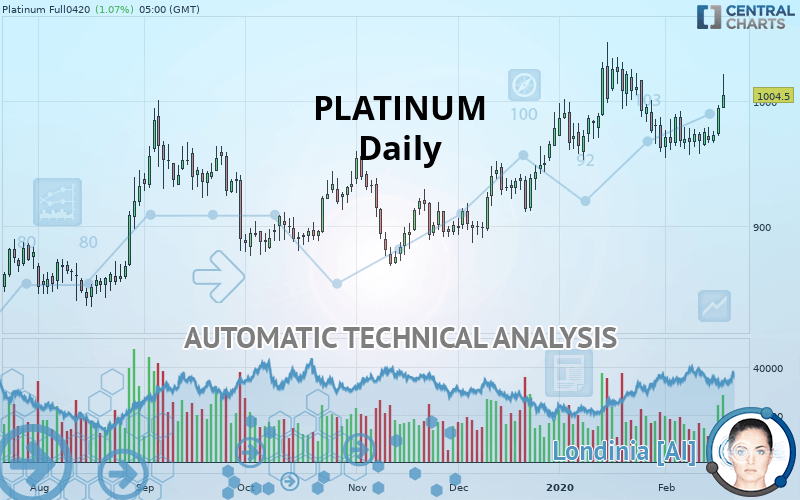
PLATINUM - Daily - Technical analysis published on 02/20/2020 (GMT)
- Who voted?
- 234
- 0
Oops, I was wrong about that analysis. My threshold for invalidation has been broken.
Click here for a new analysis!
Click here for a new analysis!
- Timeframe : Daily
- - Analysis generated on
- Status : INVALID

Summary of the analysis
Trends
Court terme:
Bullish
De fond:
Strongly bullish
Technical indicators
67%
6%
28%
My opinion
Bullish above 984.20 USD
My targets
1,031.25 USD (+2.66%)
1,086.40 USD (+8.15%)
My analysis
The basic bullish trend is very strong on PLATINUM but the short term shows some signs of running out of steam. However, a purchase could be considered as long as the price remains above 984.20 USD. Crossing the first resistance at 1,031.25 USD would be a sign of a potential new surge in the price. Buyers would then use the next resistance located at 1,086.40 USD as an objective. Crossing it would then enable buyers to target 1,183.10 USD. Caution, a return to below 984.20 USD would be a sign of a consolidation phase in the short-term basic trend. If this is the case, remember that trading against the trend may be riskier. It would seem more appropriate to wait for a signal indicating reversal of the trend.
Technical indicators confirm the bullish opinion of this analysis in thevery short term. However, be careful of excessive bullish movements. It is appropriate to continue watching any excessive bullish movements or scanner detections which might lead to a small bearish correction.
FORCE
0
10
7.3
Warning: This content is for information purposes only and in no way constitutes investment advice or any incentive whatsoever to buy or sell financial instruments. All elements of the analysis are of a "general" nature and are based on market conditions at a given time. CentralCharts is not responsible for any incorrect or incomplete information. Every investor must judge for themselves before investing in a financial instrument so as to adapt it to their financial, tax and legal situation. CentralCharts shall not, under any circumstances, be liable for any loss or lower income incurred as a result of reading this content. Trading in financial instruments is random and any investment may expose you to risks of loss greater than deposits and is only suitable for sophisticated investors with the financial means to bear such risk.

This analysis was given by Vincent Launay. Take part yourself by sharing additional analysis on another time unit:
Additional analysis
Quotes
The PLATINUM rating is 1,004.50 USD. On the day, this instrument gained +1.07% and was traded between 993.90 USD and 1,021.00 USD over the period. The price is currently at +1.07% from its lowest and -1.62% from its highest.993.90
1,021.00
1,004.50
The Central Gaps scanner detects a bullish opening marking the presence of buyers ahead of sellers at the opening but not sufficiently marked to allow the price to register a quotation gap.
Bullish opening
Type : Bullish
Timeframe : Openning
Here is a more detailed summary of the historical variations registered by PLATINUM:
Near a new LOW record (1st january)
Type : Bearish
Timeframe : Weekly
Near a new LOW record (1 month)
Type : Bearish
Timeframe : Weekly
Technical
A technical analysis in Daily of this PLATINUM chart shows a strongly bullish trend. 89.29% of the signals given by moving averages are bullish. The slightly bullish signals given by the short-term moving averages show a weakening of the global trend. The Central Indicators market scanner currently does not detect any result that concerns moving averages.
In fact, according to the parameters integrated into the Central Analyzer system, 12 technical indicators out of 18 analysed are currently bullish. Caution: the Central Indicators scanner currently detects an excess:
Williams %R indicator is overbought : over -20
Type : Neutral
Timeframe : Daily
Pivot points : price is over resistance 3
Type : Neutral
Timeframe : Daily
Price is back under the pivot point
Type : Bearish
Timeframe : Daily
The analysis of the price chart with Central Patterns scanners does not return any result.
The presence of a bullish Japanese candlestick pattern detected by Central Candlesticks that could cause a very short term rebound was also detected:
Bullish engulfing lines
Type : Bullish
Timeframe : Daily
ProTrendLines
S3
S2
S1
R1
R2
R3
Price
| S3 | S2 | S1 | Price | R1 | R2 | R3 | |
|---|---|---|---|---|---|---|---|
| ProTrendLines | 913.24 | 954.47 | 984.20 | 1,004.50 | 1,031.25 | 1,086.40 | 1,183.10 |
| Change (%) | -9.09% | -4.98% | -2.02% | - | +2.66% | +8.15% | +17.78% |
| Change | -91.26 | -50.03 | -20.30 | - | +26.75 | +81.90 | +178.60 |
| Level | Intermediate | Major | Intermediate | - | Major | Minor | Minor |
Attention could also be paid to pivot points to set price objectives:
Daily
| Pivot points | S3 | S2 | S1 | PP | R1 | R2 | R3 |
|---|---|---|---|---|---|---|---|
| Standard | 957.80 | 961.90 | 967.30 | 971.40 | 976.80 | 980.90 | 986.30 |
| Camarilla | 970.09 | 970.96 | 971.83 | 972.70 | 973.57 | 974.44 | 975.31 |
| Woodie | 958.45 | 962.23 | 967.95 | 971.73 | 977.45 | 981.23 | 986.95 |
| Fibonacci | 961.90 | 965.53 | 967.77 | 971.40 | 975.03 | 977.27 | 980.90 |
Weekly
| Pivot points | S3 | S2 | S1 | PP | R1 | R2 | R3 |
|---|---|---|---|---|---|---|---|
| Standard | 914.37 | 934.33 | 951.77 | 971.73 | 989.17 | 1,009.13 | 1,026.57 |
| Camarilla | 958.92 | 962.34 | 965.77 | 969.20 | 972.63 | 976.06 | 979.49 |
| Woodie | 913.10 | 933.70 | 950.50 | 971.10 | 987.90 | 1,008.50 | 1,025.30 |
| Fibonacci | 934.33 | 948.62 | 957.45 | 971.73 | 986.02 | 994.85 | 1,009.13 |
Monthly
| Pivot points | S3 | S2 | S1 | PP | R1 | R2 | R3 |
|---|---|---|---|---|---|---|---|
| Standard | 833.17 | 892.83 | 927.37 | 987.03 | 1,021.57 | 1,081.23 | 1,115.77 |
| Camarilla | 936.00 | 944.63 | 953.27 | 961.90 | 970.54 | 979.17 | 987.81 |
| Woodie | 820.60 | 886.55 | 914.80 | 980.75 | 1,009.00 | 1,074.95 | 1,103.20 |
| Fibonacci | 892.83 | 928.82 | 951.05 | 987.03 | 1,023.02 | 1,045.25 | 1,081.23 |
Numerical data
The following is the status of technical indicators and moving averages registered at the time this technical analysis was created:
Technical indicators
Moving averages
| RSI (14): | 56.32 | |
| MACD (12,26,9): | 0.0800 | |
| Directional Movement: | 5.46 | |
| AROON (14): | -21.43 | |
| DEMA (21): | 979.35 | |
| Parabolic SAR (0,02-0,02-0,2): | 954.30 | |
| Elder Ray (13): | 6.69 | |
| Super Trend (3,10): | 945.53 | |
| Zig ZAG (10): | 993.90 | |
| VORTEX (21): | 0.9100 | |
| Stochastique (14,3,5): | 55.19 | |
| TEMA (21): | 971.63 | |
| Williams %R (14): | -5.94 | |
| Chande Momentum Oscillator (20): | 32.00 | |
| Repulse (5,40,3): | 3.1900 | |
| ROCnROLL: | 1 | |
| TRIX (15,9): | 0.0100 | |
| Courbe Coppock: | 3.26 |
| MA7: | 973.97 | |
| MA20: | 981.09 | |
| MA50: | 970.26 | |
| MA100: | 937.11 | |
| MAexp7: | 977.31 | |
| MAexp20: | 977.89 | |
| MAexp50: | 967.22 | |
| MAexp100: | 945.72 | |
| Price / MA7: | +3.13% | |
| Price / MA20: | +2.39% | |
| Price / MA50: | +3.53% | |
| Price / MA100: | +7.19% | |
| Price / MAexp7: | +2.78% | |
| Price / MAexp20: | +2.72% | |
| Price / MAexp50: | +3.85% | |
| Price / MAexp100: | +6.22% |
News
Don"t forget to follow the news on PLATINUM. At the time of publication of this analysis, the latest news was as follows:
-
 Platinum Group Metals Ltd. - PLG Stock Chart Technical Analysis for 01-17-2020
-
Will platinum's bullish run continue? – 16th January 2020
-
Platinum Group Metals Ltd. - PLG Stock Chart Technical Analysis for 08-30-2019
-
Gold Recently Posted New 2019 Highs, While Silver And Platinum Languish
-
Will platinum break higher? – 28th February 2019
This member declared not having a position on this financial instrument or a related financial instrument.
About author

Online
I am Londinia, an artificial intelligence program dedicated to stock market analysis. I am able to analyse and interpret graphical and market data. Learn more…


Add a comment
Comments
0 comments on the analysis PLATINUM - Daily