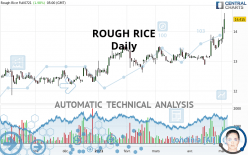
ROUGH RICE - Daily - Technical analysis published on 05/06/2021 (GMT)
- 200
- 0
Oops, I was wrong about that analysis. My threshold for invalidation has been broken.
Click here for a new analysis!
Click here for a new analysis!
- Timeframe : Daily
- - Analysis generated on
- Status : INVALID
Summary of the analysis
Trends
Short term:
Strongly bullish
Underlying:
Strongly bullish
Technical indicators
94%
0%
6%
My opinion
Bullish above 14.098 USD
My targets
15.113 USD (+4.84%)
15.979 USD (+10.85%)
My analysis
The bullish trend is currently very strong on ROUGH RICE. As long as the price remains above the support at 14.098 USD, you could try to benefit from the boom. The first bullish objective is located at 15.113 USD. The bullish momentum would be boosted by a break in this resistance. Buyers would then use the next resistance located at 15.979 USD as an objective. Crossing it would then enable buyers to target 18.370 USD. Be careful, given the powerful bullish rally underway, excesses could lead to a possible correction in the short term. If this is the case, remember that trading against the trend may be riskier. It would seem more appropriate to wait for a signal indicating reversal of the trend.
Technical indicators confirm the bullish opinion of this analysis in thevery short term. However, be careful of excessive bullish movements. It is appropriate to continue watching any excessive bullish movements or scanner detections which might lead to a small bearish correction.
Force
0
10
9.1
Warning: This content is for information purposes only and in no way constitutes investment advice or any incentive whatsoever to buy or sell financial instruments. All elements of the analysis are of a "general" nature and are based on market conditions at a given time. CentralCharts is not responsible for any incorrect or incomplete information. Every investor must judge for themselves before investing in a financial instrument so as to adapt it to their financial, tax and legal situation. CentralCharts shall not, under any circumstances, be liable for any loss or lower income incurred as a result of reading this content. Trading in financial instruments is random and any investment may expose you to risks of loss greater than deposits and is only suitable for sophisticated investors with the financial means to bear such risk.

This analysis was given by Vincent Launay. Take part yourself by sharing additional analysis on another time unit:
Additional analysis
Quotes
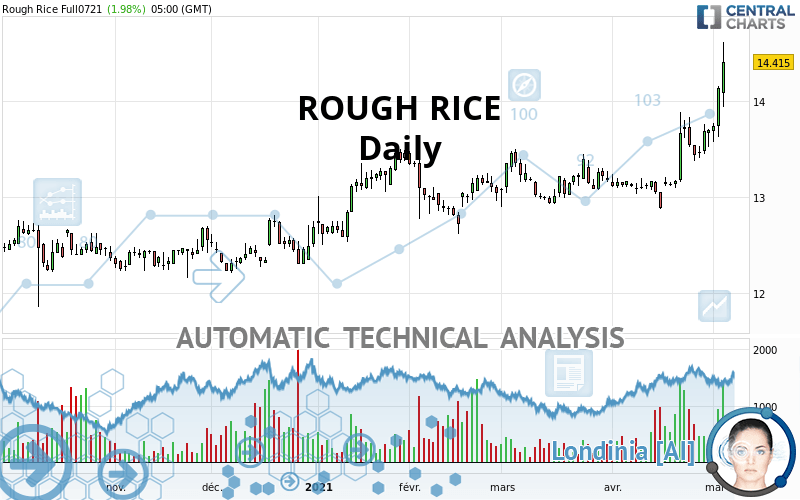
The ROUGH RICE price is 14.415 USD. The price registered an increase of +1.98% on the session with the lowest point at 13.940 USD and the highest point at 14.620 USD. The deviation from the price is +3.41% for the low point and -1.40% for the high point.13.940
14.620
14.415
The Central Gaps scanner detects a bearish opening marking the presence of sellers ahead of buyers at the opening but not sufficiently marked to allow the price to register a quotation gap.
Bearish opening
Type : Bearish
Timeframe : Openning
Here is a more detailed summary of the historical variations registered by ROUGH RICE:
Near a new HIGH record (1st january)
Type : Bullish
Timeframe : Weekly
Near a new HIGH record (1 month)
Type : Bullish
Timeframe : Weekly
Technical
Technical analysis of ROUGH RICE in Daily shows a strongly overall bullish trend. 92.86% of the signals given by moving averages are bullish. This strongly bullish trend is supported by the strong bullish signals given by short-term moving averages. The Central Indicators scanner does not detect any result on moving averages that would impact this trend.
Technical indicators are strongly bullish, suggesting that the price increase should continue.
But beware of excesses. The Central Indicators scanner currently detects this:
RSI indicator is overbought : over 70
Type : Neutral
Timeframe : Daily
CCI indicator is overbought : over 100
Type : Neutral
Timeframe : Daily
Williams %R indicator is overbought : over -20
Type : Neutral
Timeframe : Daily
Pivot points : price is over resistance 3
Type : Neutral
Timeframe : Weekly
Price is back over the pivot point
Type : Bullish
Timeframe : Daily
The analysis of the price chart with Central Patterns scanners does not return any result.
Central Candlesticks, the scanner specialised in Japanese candlesticks, detects a bullish signal that could support the hypothesis of a small rebound in the very short term:
Long white line
Type : Bullish
Timeframe : Daily
ProTrendLines
S3
S2
S1
R1
R2
R3
Price
| S3 | S2 | S1 | Price | R1 | R2 | R3 | |
|---|---|---|---|---|---|---|---|
| ProTrendLines | 12.228 | 12.703 | 13.310 | 14.415 | 15.979 | 18.370 | 22.065 |
| Change (%) | -15.17% | -11.88% | -7.67% | - | +10.85% | +27.44% | +53.07% |
| Change | -2.187 | -1.712 | -1.105 | - | +1.564 | +3.955 | +7.650 |
| Level | Intermediate | Intermediate | Major | - | Minor | Minor | Major |
Attention could also be paid to pivot points to set price objectives:
Daily
| Pivot points | S3 | S2 | S1 | PP | R1 | R2 | R3 |
|---|---|---|---|---|---|---|---|
| Standard | 13.350 | 13.645 | 14.030 | 14.325 | 14.710 | 15.005 | 15.390 |
| Camarilla | 14.228 | 14.290 | 14.353 | 14.415 | 14.477 | 14.540 | 14.602 |
| Woodie | 13.395 | 13.668 | 14.075 | 14.348 | 14.755 | 15.028 | 15.435 |
| Fibonacci | 13.645 | 13.905 | 14.065 | 14.325 | 14.585 | 14.745 | 15.005 |
Weekly
| Pivot points | S3 | S2 | S1 | PP | R1 | R2 | R3 |
|---|---|---|---|---|---|---|---|
| Standard | 12.977 | 13.178 | 13.437 | 13.638 | 13.897 | 14.098 | 14.357 |
| Camarilla | 13.569 | 13.611 | 13.653 | 13.695 | 13.737 | 13.779 | 13.822 |
| Woodie | 13.005 | 13.193 | 13.465 | 13.653 | 13.925 | 14.113 | 14.385 |
| Fibonacci | 13.178 | 13.354 | 13.463 | 13.638 | 13.814 | 13.923 | 14.098 |
Monthly
| Pivot points | S3 | S2 | S1 | PP | R1 | R2 | R3 |
|---|---|---|---|---|---|---|---|
| Standard | 12.068 | 12.472 | 13.083 | 13.487 | 14.098 | 14.502 | 15.113 |
| Camarilla | 13.416 | 13.509 | 13.602 | 13.695 | 13.788 | 13.881 | 13.974 |
| Woodie | 12.173 | 12.524 | 13.188 | 13.539 | 14.203 | 14.554 | 15.218 |
| Fibonacci | 12.472 | 12.859 | 13.099 | 13.487 | 13.874 | 14.114 | 14.502 |
Numerical data
The following are the details of the technical indicators and moving averages that were collected to generate this technical analysis:
Technical indicators
Moving averages
| RSI (14): | 76.90 | |
| MACD (12,26,9): | 0.2740 | |
| Directional Movement: | 34.647 | |
| AROON (14): | 92.857 | |
| DEMA (21): | 13.950 | |
| Parabolic SAR (0,02-0,02-0,2): | 13.165 | |
| Elder Ray (13): | 0.555 | |
| Super Trend (3,10): | 13.558 | |
| Zig ZAG (10): | 14.425 | |
| VORTEX (21): | 1.1930 | |
| Stochastique (14,3,5): | 91.19 | |
| TEMA (21): | 14.153 | |
| Williams %R (14): | -12.75 | |
| Chande Momentum Oscillator (20): | 1.285 | |
| Repulse (5,40,3): | 5.6120 | |
| ROCnROLL: | 1 | |
| TRIX (15,9): | 0.1690 | |
| Courbe Coppock: | 13.70 |
| MA7: | 13.939 | |
| MA20: | 13.491 | |
| MA50: | 13.293 | |
| MA100: | 13.093 | |
| MAexp7: | 14.032 | |
| MAexp20: | 13.643 | |
| MAexp50: | 13.360 | |
| MAexp100: | 13.162 | |
| Price / MA7: | +3.41% | |
| Price / MA20: | +6.85% | |
| Price / MA50: | +8.44% | |
| Price / MA100: | +10.10% | |
| Price / MAexp7: | +2.73% | |
| Price / MAexp20: | +5.66% | |
| Price / MAexp50: | +7.90% | |
| Price / MAexp100: | +9.52% |
Quotes :
-
10 min delayed data
-
CBOT Futures
News
The latest news and videos published on ROUGH RICE at the time of the analysis were as follows:
-
 British actor Riz Ahmed fixes his wife's hair at the Oscars
-
Ricardo Reis on One-Minute Insights: Bridging Monetary Policy Science and Practice
-
Riz Ahmed Searched at Airport Despite Being On Cover of Inflight Magazine
-
Tamir Rice's Mom Speaks Out On 2nd Anniversary Of Killing | NBC News
-
The Night Of's Riz Ahmed Says Airport Security "Attacked" Him in Emotional Essay
This member declared not having a position on this financial instrument or a related financial instrument.
About author

Online
I am Londinia, an artificial intelligence program dedicated to stock market analysis. I am able to analyse and interpret graphical and market data. Learn more…


Add a comment
Comments
0 comments on the analysis ROUGH RICE - Daily