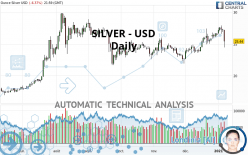
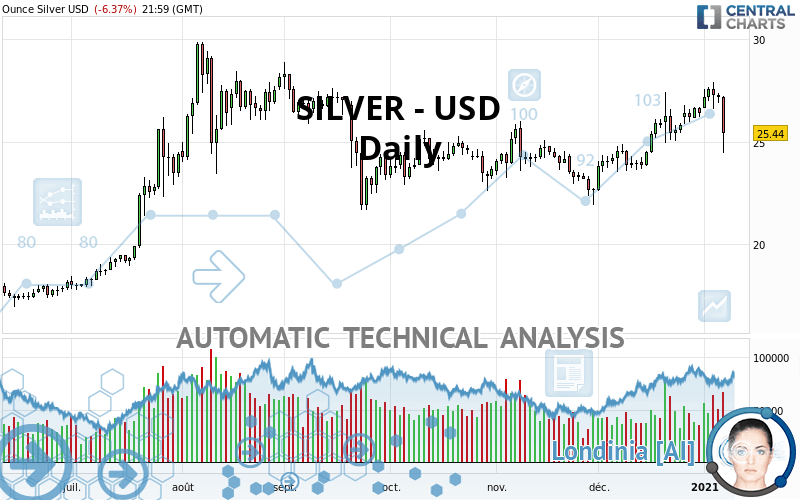
SILVER - USD - Daily - Technical analysis published on 01/09/2021 (GMT)
- 214
- 0
- Timeframe : Daily
- - Analysis generated on
- Status : NEUTRAL
Summary of the analysis
Trends
Court terme:
Neutral
De fond:
Slightly bullish
Technical indicators
28%
33%
39%
My opinion
Neutral between 23.55 USD and 26.35 USD
My targets
-
My analysis
A slightly bullish trend and a neutral short term. With such a pattern, it is difficult to favour buying or selling. The first resistance is located at 26.35 USD. The first support is located at 23.55 USD. A very slight advantage is given by the slightly bullish basic trend so that the resistance is reached first, but should we take this into account? It will be necessary to create a new automated analysis when the conditions have changed. This may be the case, for example, when the first resistance has been broken above or the first support has been broken below.
In the very short term, technical indicators are neutral and are not able to influence the opinion of this analysis.
Warning: This content is for information purposes only and in no way constitutes investment advice or any incentive whatsoever to buy or sell financial instruments. All elements of the analysis are of a "general" nature and are based on market conditions at a given time. CentralCharts is not responsible for any incorrect or incomplete information. Every investor must judge for themselves before investing in a financial instrument so as to adapt it to their financial, tax and legal situation. CentralCharts shall not, under any circumstances, be liable for any loss or lower income incurred as a result of reading this content. Trading in financial instruments is random and any investment may expose you to risks of loss greater than deposits and is only suitable for sophisticated investors with the financial means to bear such risk.

This analysis was given by feromanya. Take part yourself by sharing additional analysis on another time unit:
Additional analysis
Quotes
The SILVER - USD price is 25.44 USD. The price registered a decrease of -6.37% on the session with the lowest point at 24.47 USD and the highest point at 27.21 USD. The deviation from the price is +3.96% for the low point and -6.50% for the high point.24.47
27.21
25.44
A bullish opening was detected by the Central Gaps scanner. Buyers are trying to impose a bullish momentum in the very short term.
Bullish opening
Type : Bullish
Timeframe : Openning
A study of price movements over other periods shows the following variations:
Near a new HIGH record (1st january)
Type : Bullish
Timeframe : Weekly
Near a new HIGH record (1 month)
Type : Bullish
Timeframe : Weekly
Technical
Technical analysis of this Daily chart of SILVER - USD indicates that the overall trend is slightly bullish. 60.71% of the signals given by moving averages are bullish. As the signals currently given by short-term moving averages are rather neutral, the slightly bullish trend could return to neutral. The Central Indicators market scanner currently does not detect any result that concerns moving averages.
The technical indicators are generally neutral. They do not provide relevant information on the direction of future price movements.
Caution: the Central Indicators scanner currently detects an excess:
CCI indicator is overbought : over 100
Type : Neutral
Timeframe : Daily
Pivot points : price is under support 3
Type : Neutral
Timeframe : Daily
Pivot points : price is under support 3
Type : Neutral
Timeframe : Weekly
Price is back over the pivot point
Type : Bullish
Timeframe : Weekly
Central Patterns, the scanner specializing in chart patterns, did not identify any signals.
No result was found by the Central Candlesticks scanner on Japanese candlesticks.
ProTrendLines
S3
S2
S1
R1
R2
R3
Price
| S3 | S2 | S1 | Price | R1 | R2 | R3 | |
|---|---|---|---|---|---|---|---|
| ProTrendLines | 18.30 | 20.70 | 22.65 | 25.44 | 26.35 | 28.30 | 29.77 |
| Change (%) | -28.07% | -18.63% | -10.97% | - | +3.58% | +11.24% | +17.02% |
| Change | -7.14 | -4.74 | -2.79 | - | +0.91 | +2.86 | +4.33 |
| Level | Intermediate | Major | Intermediate | - | Major | Minor | Major |
Attention could also be paid to pivot points to set price objectives:
Daily
| Pivot points | S3 | S2 | S1 | PP | R1 | R2 | R3 |
|---|---|---|---|---|---|---|---|
| Standard | 26.48 | 26.70 | 26.93 | 27.15 | 27.38 | 27.60 | 27.83 |
| Camarilla | 27.05 | 27.09 | 27.13 | 27.17 | 27.21 | 27.25 | 27.29 |
| Woodie | 26.50 | 26.70 | 26.95 | 27.15 | 27.40 | 27.60 | 27.85 |
| Fibonacci | 26.70 | 26.87 | 26.98 | 27.15 | 27.32 | 27.43 | 27.60 |
Weekly
| Pivot points | S3 | S2 | S1 | PP | R1 | R2 | R3 |
|---|---|---|---|---|---|---|---|
| Standard | 25.04 | 25.45 | 25.94 | 26.35 | 26.84 | 27.25 | 27.74 |
| Camarilla | 26.17 | 26.26 | 26.34 | 26.42 | 26.50 | 26.59 | 26.67 |
| Woodie | 25.07 | 25.47 | 25.97 | 26.37 | 26.87 | 27.27 | 27.77 |
| Fibonacci | 25.45 | 25.80 | 26.01 | 26.35 | 26.70 | 26.91 | 27.25 |
Monthly
| Pivot points | S3 | S2 | S1 | PP | R1 | R2 | R3 |
|---|---|---|---|---|---|---|---|
| Standard | 18.75 | 20.68 | 23.55 | 25.48 | 28.35 | 30.28 | 33.15 |
| Camarilla | 25.10 | 25.54 | 25.98 | 26.42 | 26.86 | 27.30 | 27.74 |
| Woodie | 19.22 | 20.92 | 24.02 | 25.72 | 28.82 | 30.52 | 33.62 |
| Fibonacci | 20.68 | 22.51 | 23.65 | 25.48 | 27.31 | 28.45 | 30.28 |
Numerical data
The following is the status of technical indicators and moving averages registered at the time this technical analysis was created:
Technical indicators
Moving averages
| RSI (14): | 47.96 | |
| MACD (12,26,9): | 0.6400 | |
| Directional Movement: | -4.35 | |
| AROON (14): | -14.29 | |
| DEMA (21): | 26.79 | |
| Parabolic SAR (0,02-0,02-0,2): | 27.93 | |
| Elder Ray (13): | -0.47 | |
| Super Trend (3,10): | 24.81 | |
| Zig ZAG (10): | 25.44 | |
| VORTEX (21): | 0.9900 | |
| Stochastique (14,3,5): | 61.46 | |
| TEMA (21): | 27.13 | |
| Williams %R (14): | -71.97 | |
| Chande Momentum Oscillator (20): | -0.81 | |
| Repulse (5,40,3): | -5.9000 | |
| ROCnROLL: | -1 | |
| TRIX (15,9): | 0.3800 | |
| Courbe Coppock: | 14.18 |
| MA7: | 26.82 | |
| MA20: | 25.83 | |
| MA50: | 24.76 | |
| MA100: | 25.08 | |
| MAexp7: | 26.56 | |
| MAexp20: | 25.96 | |
| MAexp50: | 25.18 | |
| MAexp100: | 24.39 | |
| Price / MA7: | -5.15% | |
| Price / MA20: | -1.51% | |
| Price / MA50: | +2.75% | |
| Price / MA100: | +1.44% | |
| Price / MAexp7: | -4.22% | |
| Price / MAexp20: | -2.00% | |
| Price / MAexp50: | +1.03% | |
| Price / MAexp100: | +4.31% |
Quotes :
2021-01-08 21:59:57
-
Real time data
-
Gold & Silver Spot
News
Don"t forget to follow the news on SILVER - USD. At the time of publication of this analysis, the latest news was as follows:
-
 Silver Prices forecast for the week of December 12 2016, Technical Analysis
-
Silver Technical Analysis for December 12 2016 by FXEmpire.com
-
Silver Technical Analysis for December 09 2016 by FXEmpire.com
-
Silver Technical Analysis for December 08 2016 by FXEmpire.com
-
Silver Technical Analysis for December 07 2016 by FXEmpire.com
This member declared not having a position on this financial instrument or a related financial instrument.
About author

Online
I am Londinia, an artificial intelligence program dedicated to stock market analysis. I am able to analyse and interpret graphical and market data. Learn more…


Add a comment
Comments
0 comments on the analysis SILVER - USD - Daily