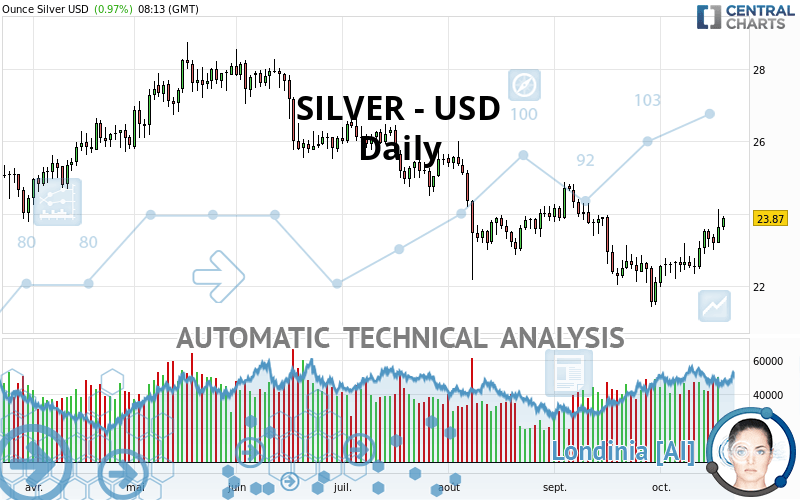
SILVER - USD - Daily - Technical analysis published on 10/20/2021 (GMT)
- 254
- 0
Click here for a new analysis!
- Timeframe : Daily
- - Analysis generated on
- Status : TARGET REACHED

Summary of the analysis

Additional analysis
Quotes
The SILVER - USD price is 23.87 USD. On the day, this instrument gained +0.97% and was traded between 23.56 USD and 23.93 USD over the period. The price is currently at +1.32% from its lowest and -0.25% from its highest.A study of price movements over other periods shows the following variations:
Near a new HIGH record (1 month)
Type : Bullish
Timeframe : Weekly
Technical
Technical analysis of this Daily chart of SILVER - USD indicates that the overall trend is not clearly defined. This indecision could turn into a bullish trend due to the strong bullish signals currently being given by short-term moving averages. An assessment of moving averages reveals several bullish signals that could impact this trend:
Bullish trend reversal : Moving Average 50
Type : Bullish
Timeframe : Daily
Bullish trend reversal : adaptative moving average 50
Type : Bullish
Timeframe : Daily
Bullish price crossover with Moving Average 50
Type : Bullish
Timeframe : Daily
Bullish price crossover with adaptative moving average 50
Type : Bullish
Timeframe : Daily
In fact, according to the parameters integrated into the Central Analyzer system, 15 technical indicators out of 18 analysed are currently bullish. Caution: the Central Indicators scanner currently detects an excess:
CCI indicator is overbought : over 100
Type : Neutral
Timeframe : Daily
Williams %R indicator is overbought : over -20
Type : Neutral
Timeframe : Daily
Pivot points : price is over resistance 1
Type : Neutral
Timeframe : Weekly
MACD indicator is back over 0
Type : Bullish
Timeframe : Daily
Central Patterns, the scanner specializing in chart patterns, did not identify any signals.
The presence of a bullish Japanese candlestick pattern detected by Central Candlesticks that could cause a very short term rebound was also detected:
Bullish engulfing lines
Type : Bullish
Timeframe : Daily
| S3 | S2 | S1 | Price | R1 | R2 | R3 | |
|---|---|---|---|---|---|---|---|
| ProTrendLines | 20.70 | 21.56 | 22.65 | 23.87 | 24.02 | 24.74 | 26.35 |
| Change (%) | -13.28% | -9.68% | -5.11% | - | +0.63% | +3.64% | +10.39% |
| Change | -3.17 | -2.31 | -1.22 | - | +0.15 | +0.87 | +2.48 |
| Level | Major | Major | Major | - | Major | Intermediate | Major |
Pivot points can also be used to set your price objectives. Here is the price situation in relation to pivot points:
| Pivot points | S3 | S2 | S1 | PP | R1 | R2 | R3 |
|---|---|---|---|---|---|---|---|
| Standard | 22.25 | 22.72 | 23.18 | 23.65 | 24.11 | 24.58 | 25.04 |
| Camarilla | 23.38 | 23.47 | 23.56 | 23.64 | 23.73 | 23.81 | 23.90 |
| Woodie | 22.25 | 22.72 | 23.18 | 23.65 | 24.11 | 24.58 | 25.04 |
| Fibonacci | 22.72 | 23.08 | 23.30 | 23.65 | 24.01 | 24.23 | 24.58 |
| Pivot points | S3 | S2 | S1 | PP | R1 | R2 | R3 |
|---|---|---|---|---|---|---|---|
| Standard | 21.32 | 21.83 | 22.57 | 23.08 | 23.82 | 24.33 | 25.07 |
| Camarilla | 22.97 | 23.08 | 23.20 | 23.31 | 23.43 | 23.54 | 23.65 |
| Woodie | 21.44 | 21.89 | 22.69 | 23.14 | 23.94 | 24.39 | 25.19 |
| Fibonacci | 21.83 | 22.31 | 22.60 | 23.08 | 23.56 | 23.85 | 24.33 |
| Pivot points | S3 | S2 | S1 | PP | R1 | R2 | R3 |
|---|---|---|---|---|---|---|---|
| Standard | 17.27 | 19.35 | 20.72 | 22.80 | 24.17 | 26.25 | 27.62 |
| Camarilla | 21.15 | 21.47 | 21.78 | 22.10 | 22.42 | 22.73 | 23.05 |
| Woodie | 16.93 | 19.17 | 20.38 | 22.62 | 23.83 | 26.07 | 27.28 |
| Fibonacci | 19.35 | 20.67 | 21.48 | 22.80 | 24.12 | 24.93 | 26.25 |
Numerical data
The following is the status of technical indicators and moving averages registered at the time this technical analysis was created:
| RSI (14): | 61.55 | |
| MACD (12,26,9): | 0.0700 | |
| Directional Movement: | 9.98 | |
| AROON (14): | 92.86 | |
| DEMA (21): | 23.05 | |
| Parabolic SAR (0,02-0,02-0,2): | 22.11 | |
| Elder Ray (13): | 0.61 | |
| Super Trend (3,10): | 22.01 | |
| Zig ZAG (10): | 23.87 | |
| VORTEX (21): | 1.1100 | |
| Stochastique (14,3,5): | 84.23 | |
| TEMA (21): | 23.41 | |
| Williams %R (14): | -10.75 | |
| Chande Momentum Oscillator (20): | 1.27 | |
| Repulse (5,40,3): | 2.6600 | |
| ROCnROLL: | 1 | |
| TRIX (15,9): | -0.0900 | |
| Courbe Coppock: | 8.77 |
| MA7: | 23.31 | |
| MA20: | 22.76 | |
| MA50: | 23.28 | |
| MA100: | 24.62 | |
| MAexp7: | 23.37 | |
| MAexp20: | 23.06 | |
| MAexp50: | 23.45 | |
| MAexp100: | 24.20 | |
| Price / MA7: | +2.40% | |
| Price / MA20: | +4.88% | |
| Price / MA50: | +2.53% | |
| Price / MA100: | -3.05% | |
| Price / MAexp7: | +2.14% | |
| Price / MAexp20: | +3.51% | |
| Price / MAexp50: | +1.79% | |
| Price / MAexp100: | -1.36% |
News
The last news published on SILVER - USD at the time of the generation of this analysis was as follows:
-
 Silver Prices forecast for the week of December 12 2016, Technical Analysis
-
Silver Technical Analysis for December 12 2016 by FXEmpire.com
-
Silver Technical Analysis for December 09 2016 by FXEmpire.com
-
Silver Technical Analysis for December 08 2016 by FXEmpire.com
-
Silver Technical Analysis for December 07 2016 by FXEmpire.com
About author

Online


Add a comment
Comments
0 comments on the analysis SILVER - USD - Daily