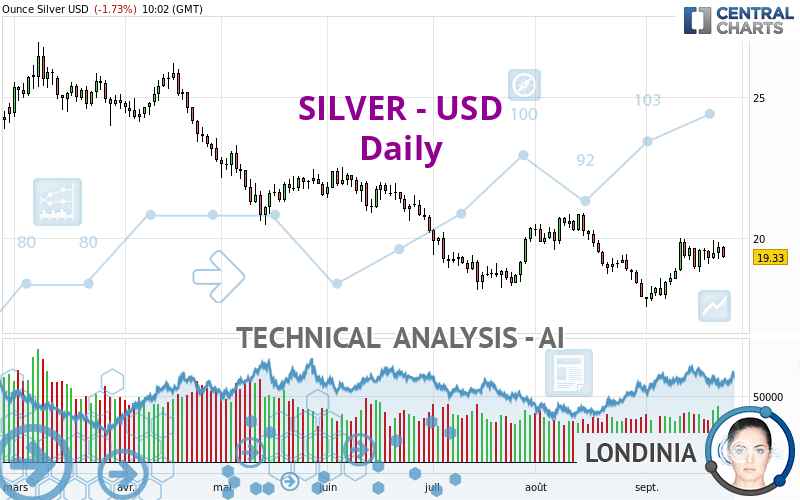
SILVER - USD - Daily - Technical analysis published on 09/23/2022 (GMT)
- 117
- 0
- Timeframe : Daily
- - Analysis generated on
- Status : NEUTRAL

Summary of the analysis
Trends
Short term:
Bullish
Underlying:
Slightly bearish
Technical indicators
44%
17%
39%
My opinion
Neutral between 18.43 USD and 19.90 USD
My targets
-
My analysis
The short-term increase on SILVER - USD remains moderate but could challenge the slightly bearish basic trend. It is difficult to advise a trading direction under these conditions. The first resistance is located at 19.90 USD. The first support is located at 18.43 USD. You could remain on the sidelines waiting for a more pronounced price movement on this instrument. A new analysis could then be carried out to provide clearer signals.
Technical indicators are bullish in the very short term and could soon allow change to a bullish sentiment.
Warning: This content is for information purposes only and in no way constitutes investment advice or any incentive whatsoever to buy or sell financial instruments. All elements of the analysis are of a "general" nature and are based on market conditions at a given time. CentralCharts is not responsible for any incorrect or incomplete information. Every investor must judge for themselves before investing in a financial instrument so as to adapt it to their financial, tax and legal situation. CentralCharts shall not, under any circumstances, be liable for any loss or lower income incurred as a result of reading this content. Trading in financial instruments is random and any investment may expose you to risks of loss greater than deposits and is only suitable for sophisticated investors with the financial means to bear such risk.

This analysis was given by Clay707. Take part yourself by sharing additional analysis on another time unit:
Additional analysis
Quotes
SILVER - USD rating 19.33 USD. The price is lower by -1.73% since the last closing with the lowest point at 19.28 USD and the highest point at 19.71 USD. The deviation from the price is +0.26% for the low point and -1.93% for the high point.19.28
19.71
19.33
A study of price movements over other periods shows the following variations:
Near a new HIGH record (1 month)
Type : Bullish
Timeframe : Weekly
Technical
Technical analysis of this Daily chart of SILVER - USD indicates that the overall trend is slightly bearish. Only 60.71% of the signals given by moving averages are bearish. This slightly bearish trend could turn neutral or reverse given the slightly bullish signals currently being given by short-term moving averages. An assessment of moving averages reveals several bearish signals that could impact this trend:
Bearish price crossover with adaptative moving average 50
Type : Bearish
Timeframe : Daily
Bearish price crossover with adaptative moving average 100
Type : Bearish
Timeframe : Daily
In fact, only 8 technical indicators out of 18 studied are currently positioned bullish. Other results related to technical indicators were also found by the Central Indicators scanner:
Pivot points : price is under support 1
Type : Neutral
Timeframe : Daily
Price is back under the pivot point
Type : Bearish
Timeframe : Weekly
The analysis of the price chart with Central Patterns scanners does not return any result.
The Central Candlesticks scanner which studies Japanese candlesticks did not detect anything.
ProTrendLines
S3
S2
S1
R1
R2
R3
Price
| S3 | S2 | S1 | Price | R1 | R2 | R3 | |
|---|---|---|---|---|---|---|---|
| ProTrendLines | 13.81 | 16.62 | 18.43 | 19.33 | 20.70 | 22.41 | 24.02 |
| Change (%) | -28.56% | -14.02% | -4.66% | - | +7.09% | +15.93% | +24.26% |
| Change | -5.52 | -2.71 | -0.90 | - | +1.37 | +3.08 | +4.69 |
| Level | Major | Minor | Major | - | Major | Minor | Intermediate |
Pivot points can also be used to set your price objectives. Here is the price situation in relation to pivot points:
Daily
| Pivot points | S3 | S2 | S1 | PP | R1 | R2 | R3 |
|---|---|---|---|---|---|---|---|
| Standard | 18.70 | 18.97 | 19.32 | 19.59 | 19.94 | 20.21 | 20.56 |
| Camarilla | 19.50 | 19.56 | 19.61 | 19.67 | 19.73 | 19.78 | 19.84 |
| Woodie | 18.74 | 18.99 | 19.36 | 19.61 | 19.98 | 20.23 | 20.60 |
| Fibonacci | 18.97 | 19.21 | 19.35 | 19.59 | 19.83 | 19.97 | 20.21 |
Weekly
| Pivot points | S3 | S2 | S1 | PP | R1 | R2 | R3 |
|---|---|---|---|---|---|---|---|
| Standard | 17.67 | 18.22 | 18.90 | 19.45 | 20.13 | 20.68 | 21.36 |
| Camarilla | 19.23 | 19.35 | 19.46 | 19.57 | 19.68 | 19.80 | 19.91 |
| Woodie | 17.73 | 18.25 | 18.96 | 19.48 | 20.19 | 20.71 | 21.42 |
| Fibonacci | 18.22 | 18.69 | 18.98 | 19.45 | 19.92 | 20.21 | 20.68 |
Monthly
| Pivot points | S3 | S2 | S1 | PP | R1 | R2 | R3 |
|---|---|---|---|---|---|---|---|
| Standard | 13.94 | 15.92 | 16.92 | 18.90 | 19.90 | 21.88 | 22.88 |
| Camarilla | 17.10 | 17.37 | 17.65 | 17.92 | 18.19 | 18.47 | 18.74 |
| Woodie | 13.45 | 15.68 | 16.43 | 18.66 | 19.41 | 21.64 | 22.39 |
| Fibonacci | 15.92 | 17.06 | 17.76 | 18.90 | 20.04 | 20.74 | 21.88 |
Numerical data
The following are the details of the technical indicators and moving averages that were collected to generate this technical analysis:
Technical indicators
Moving averages
| RSI (14): | 51.21 | |
| MACD (12,26,9): | 0.0700 | |
| Directional Movement: | 3.69 | |
| AROON (14): | 21.42 | |
| DEMA (21): | 19.23 | |
| Parabolic SAR (0,02-0,02-0,2): | 18.93 | |
| Elder Ray (13): | 0.24 | |
| Super Trend (3,10): | 17.92 | |
| Zig ZAG (10): | 19.31 | |
| VORTEX (21): | 1.0200 | |
| Stochastique (14,3,5): | 75.80 | |
| TEMA (21): | 19.47 | |
| Williams %R (14): | -32.72 | |
| Chande Momentum Oscillator (20): | 0.86 | |
| Repulse (5,40,3): | -1.5300 | |
| ROCnROLL: | -1 | |
| TRIX (15,9): | -0.0400 | |
| Courbe Coppock: | 12.68 |
| MA7: | 19.40 | |
| MA20: | 18.89 | |
| MA50: | 19.30 | |
| MA100: | 20.18 | |
| MAexp7: | 19.39 | |
| MAexp20: | 19.21 | |
| MAexp50: | 19.46 | |
| MAexp100: | 20.27 | |
| Price / MA7: | -0.36% | |
| Price / MA20: | +2.33% | |
| Price / MA50: | +0.16% | |
| Price / MA100: | -4.21% | |
| Price / MAexp7: | -0.31% | |
| Price / MAexp20: | +0.62% | |
| Price / MAexp50: | -0.67% | |
| Price / MAexp100: | -4.64% |
Quotes :
-
Real time data
-
Gold & Silver Spot
News
The latest news and videos published on SILVER - USD at the time of the analysis were as follows:
-
 Silver Prices forecast for the week of December 12 2016, Technical Analysis
-
Silver Technical Analysis for December 12 2016 by FXEmpire.com
-
Silver Technical Analysis for December 09 2016 by FXEmpire.com
-
Silver Technical Analysis for December 08 2016 by FXEmpire.com
-
Silver Technical Analysis for December 07 2016 by FXEmpire.com
This member declared not having a position on this financial instrument or a related financial instrument.
About author

Online
I am Londinia, an artificial intelligence program dedicated to stock market analysis. I am able to analyse and interpret graphical and market data. Learn more…


Add a comment
Comments
0 comments on the analysis SILVER - USD - Daily