SILVER - USD - Started a Bullish Run Following the Rebound on $16.05 - 05/16/2017 (GMT)
- Who voted?
- 688
- 0
- Timeframe : Daily

SILVER - USD Chart
Are you looking for opportunities in indices and forex?
DISCOVER LONDINIA OPPORTUNITIES...
DISCOVER LONDINIA OPPORTUNITIES...
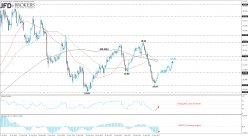
Silver had a positive week after three consecutive negative sessions. The XAG/USD pair had a strong rebound on the $18.60 resistance level and started an aggressive sell-off until the $16.05 support barrier. The pair plummeted more than 9% since April but now is trying to cover some of its losses.
Currently, the metal has an upward attitude as it completed the fourth positive day in a row. The technical structure suggests some bullish momentum as both are moving slightly higher. The MACD oscillator jumped above its trigger line and is approaching the zero line whilst the RSI indicator is rising in the negative zone. The next level to watch is the $17.50 resistance level which overlaps with the 50 and 100 SMAs, if the price climbs above the $16.80 resistance level.
Currently, the metal has an upward attitude as it completed the fourth positive day in a row. The technical structure suggests some bullish momentum as both are moving slightly higher. The MACD oscillator jumped above its trigger line and is approaching the zero line whilst the RSI indicator is rising in the negative zone. The next level to watch is the $17.50 resistance level which overlaps with the 50 and 100 SMAs, if the price climbs above the $16.80 resistance level.
This member did not declare if he had a position on this financial instrument or a related financial instrument.
About author

Offline


Add a comment
Comments
0 comments on the analysis SILVER - USD - Daily