SILVER - USD - XAG/USD Dropped Aggressively This Month Creating a Correction Mode - 09/25/2017 (GMT)
- Who voted?
- 611
- 0
- Timeframe : Daily
SILVER - USD Chart
Are you looking for opportunities in indices and forex?
DISCOVER LONDINIA OPPORTUNITIES...
DISCOVER LONDINIA OPPORTUNITIES...
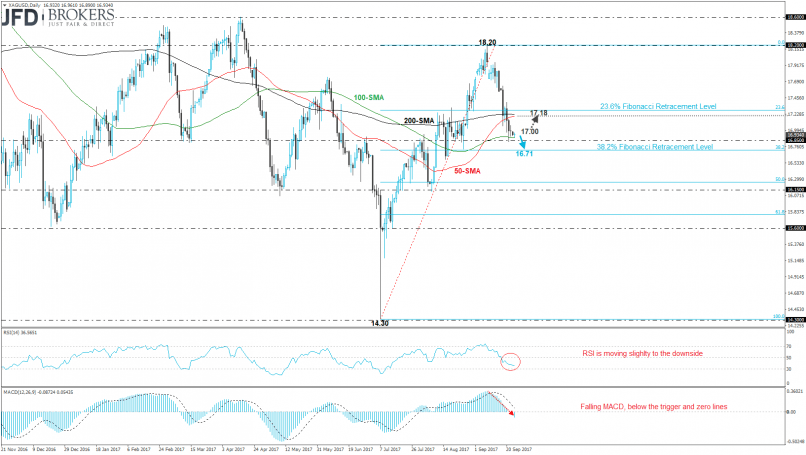
The white metal plunged more than 3% in September, after the strong pullback on the $18.20 resistance barrier, four-month high. Silver is creating a correction movement and is developing near the 100-day SMA, as well as near the $16.85 support level. Our expectation is a further decline to 38.2% Fibonacci retracement level (low at $14.30 and high at $18.20) at $16.71, at least.
On the other hand, in case of a bullish movement, the XAG/USD pair will touch the 50-day SMA, near $17.18. It is worth to mention that the price sank below the 50 and 200 week SMAs, while it struggled near the 100-week SMA. On the daily timeframe, the RSI indicator fell into the bearish zone and the MACD oscillator dropped below the zero and trigger lines with stronger momentum than before.
On the other hand, in case of a bullish movement, the XAG/USD pair will touch the 50-day SMA, near $17.18. It is worth to mention that the price sank below the 50 and 200 week SMAs, while it struggled near the 100-week SMA. On the daily timeframe, the RSI indicator fell into the bearish zone and the MACD oscillator dropped below the zero and trigger lines with stronger momentum than before.
This member declared not having a position on this financial instrument or a related financial instrument.
About author

Offline


Add a comment
Comments
0 comments on the analysis SILVER - USD - Daily