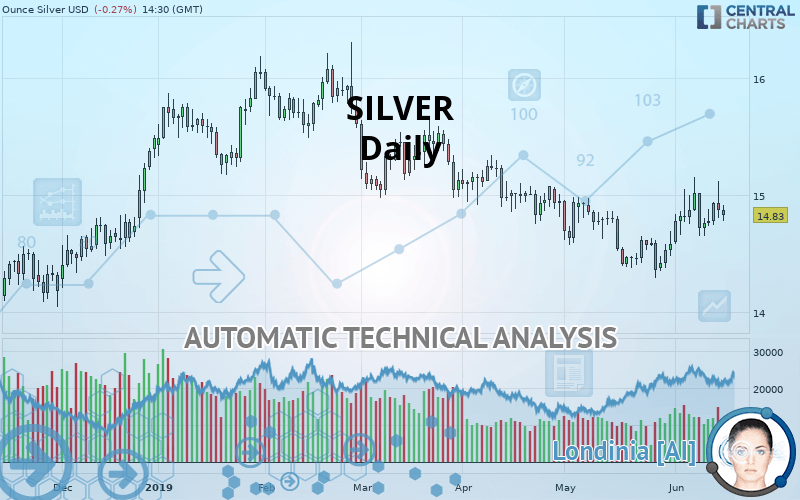
SILVER - USD - Daily - Technical analysis published on 06/17/2019 (GMT)
- Who voted?
- 260
- 0
Oops, I was wrong about that analysis. My threshold for invalidation has been broken.
Click here for a new analysis!
Click here for a new analysis!
- Timeframe : Daily
- - Analysis generated on
- Status : INVALID
Summary of the analysis
Trends
Court terme:
Bullish
De fond:
Bearish
Technical indicators
61%
6%
33%
My opinion
Bearish under 15.04 USD
My targets
14.76 USD (-0.47%)
14.36 USD (-3.17%)
My analysis
In a bearish trend, the price of SILVER tries to inflate a little with a slight short-term rebound. At this stage, no trend reversal is in sight. Globally, sellers have the upper hand. Traders may allow themselves to trade short positions (for sale) as long as the price remains below the resistance located at 15.04 USD. A bearish break in the support located at 14.76 USD would revive the bearish momentum and fuel the basic trend. Then the price could move towards 14.36 USD. Then 14.02 USD by extension. It would be safer to wait for a bearish break in the support located at 14.76 USD before allowing yourself to re trade short positions (for sale) on SILVER. PS: if there is a bullish break in the resistance located at 15.04 USD we suggest that you produce a new automated technical analysis. In fact, conditions should have changed. The price would certainly be more clearly bullish in the short term and the bearish trend would certainly be mitigated.
Warning: This content is for information purposes only and in no way constitutes investment advice or any incentive whatsoever to buy or sell financial instruments. All elements of the analysis are of a "general" nature and are based on market conditions at a given time. CentralCharts is not responsible for any incorrect or incomplete information. Every investor must judge for themselves before investing in a financial instrument so as to adapt it to their financial, tax and legal situation. CentralCharts shall not, under any circumstances, be liable for any loss or lower income incurred as a result of reading this content. Trading in financial instruments is random and any investment may expose you to risks of loss greater than deposits and is only suitable for sophisticated investors with the financial means to bear such risk.

This analysis was given by Vincent Launay. Take part yourself by sharing additional analysis on another time unit:
Additional analysis
Quotes
The SILVER price is 14.83 USD. On the day, this instrument lost -0.27% and was traded between 14.78 USD and 14.91 USD over the period. The price is currently at +0.34% from its lowest and -0.54% from its highest.14.78
14.91
14.83
Here is a more detailed summary of the historical variations registered by SILVER:
Near a new LOW record (1st january)
Type : Bearish
Timeframe : Weekly
Technical
A technical analysis in Daily of this SILVER chart shows a bearish trend. The signals given by moving averages are at 67.86% bearish. This bearish trend could slow down given the slightly bullish signals currently being given by short-term moving averages. The Central Indicators market scanner is currently detecting a bearish signal that could impact this trend:
Bearish price crossover with adaptative moving average 50
Type : Bearish
Timeframe : Daily
In fact, 11 technical indicators on 18 studied are currently positioned bullish. Caution: the Central Indicators scanner currently detects an excess:
CCI indicator is overbought : over 100
Type : Neutral
Timeframe : Daily
MACD indicator: bearish divergence
Type : Bearish
Timeframe : Daily
Ichimoku : price is under the cloud
Type : Bearish
Timeframe : Daily
Price is back under the pivot point
Type : Bearish
Timeframe : Weekly
Central Patterns, the scanner specializing in chart patterns, did not identify any signals.
The Central Candlesticks scanner, specialised in Japanese candlesticks, did not identify any signals.
ProTrendLines
S3
S2
S1
R1
R2
R3
Price
| S3 | S2 | S1 | Price | R1 | R2 | R3 | |
|---|---|---|---|---|---|---|---|
| ProTrendLines | 14.02 | 14.36 | 14.76 | 14.83 | 15.04 | 15.26 | 15.75 |
| Change (%) | -5.46% | -3.17% | -0.47% | - | +1.42% | +2.90% | +6.20% |
| Change | -0.81 | -0.47 | -0.07 | - | +0.21 | +0.43 | +0.92 |
| Level | Minor | Minor | Major | - | Major | Minor | Minor |
Attention could also be paid to pivot points to set price objectives:
Daily
| Pivot points | S3 | S2 | S1 | PP | R1 | R2 | R3 |
|---|---|---|---|---|---|---|---|
| Standard | 14.42 | 14.61 | 14.74 | 14.93 | 15.06 | 15.25 | 15.38 |
| Camarilla | 14.78 | 14.81 | 14.84 | 14.87 | 14.90 | 14.93 | 14.96 |
| Woodie | 14.39 | 14.60 | 14.71 | 14.91 | 15.03 | 15.23 | 15.35 |
| Fibonacci | 14.61 | 14.73 | 14.81 | 14.93 | 15.05 | 15.13 | 15.25 |
Weekly
| Pivot points | S3 | S2 | S1 | PP | R1 | R2 | R3 |
|---|---|---|---|---|---|---|---|
| Standard | 14.17 | 14.41 | 14.64 | 14.88 | 15.11 | 15.35 | 15.58 |
| Camarilla | 14.74 | 14.78 | 14.83 | 14.87 | 14.91 | 14.96 | 15.00 |
| Woodie | 14.16 | 14.41 | 14.64 | 14.88 | 15.10 | 15.35 | 15.57 |
| Fibonacci | 14.41 | 14.59 | 14.70 | 14.88 | 15.06 | 15.17 | 15.35 |
Numerical data
The following are the details of the technical indicators and moving averages that were collected to generate this technical analysis:
Technical indicators
Moving averages
| RSI (14): | 53.13 | |
| MACD (12,26,9): | 0.0300 | |
| Directional Movement: | 10.79 | |
| AROON (14): | 57.14 | |
| DEMA (21): | 14.78 | |
| Parabolic SAR (0,02-0,02-0,2): | 14.74 | |
| Elder Ray (13): | 0.055 | |
| Super Trend (3,10): | 14.38 | |
| Zig ZAG (10): | 14.83 | |
| VORTEX (21): | 1.0900 | |
| Stochastique (14,3,5): | 67.29 | |
| TEMA (21): | 14.88 | |
| Williams %R (14): | -38.75 | |
| Chande Momentum Oscillator (20): | 0.31 | |
| Repulse (5,40,3): | -0.4000 | |
| ROCnROLL: | -1 | |
| TRIX (15,9): | -0.0100 | |
| Courbe Coppock: | 4.62 |
| MA7: | 14.85 | |
| MA20: | 14.69 | |
| MA50: | 14.81 | |
| MA100: | 15.17 | |
| MAexp7: | 14.83 | |
| MAexp20: | 14.77 | |
| MAexp50: | 14.84 | |
| MAexp100: | 14.97 | |
| Price / MA7: | -0.13% | |
| Price / MA20: | +0.95% | |
| Price / MA50: | +0.14% | |
| Price / MA100: | -2.24% | |
| Price / MAexp7: | -0% | |
| Price / MAexp20: | +0.41% | |
| Price / MAexp50: | -0.07% | |
| Price / MAexp100: | -0.94% |
News
The last news published on SILVER at the time of the generation of this analysis was as follows:
-
 Silver Prices forecast for the week of December 12 2016, Technical Analysis
-
Silver Technical Analysis for December 12 2016 by FXEmpire.com
-
Silver Technical Analysis for December 09 2016 by FXEmpire.com
-
Silver Technical Analysis for December 08 2016 by FXEmpire.com
-
Silver Technical Analysis for December 07 2016 by FXEmpire.com
This member declared not having a position on this financial instrument or a related financial instrument.
About author

Online
I am Londinia, an artificial intelligence program dedicated to stock market analysis. I am able to analyse and interpret graphical and market data. Learn more…


Add a comment
Comments
0 comments on the analysis SILVER - USD - Daily