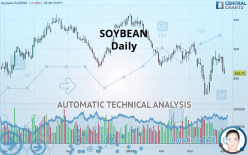
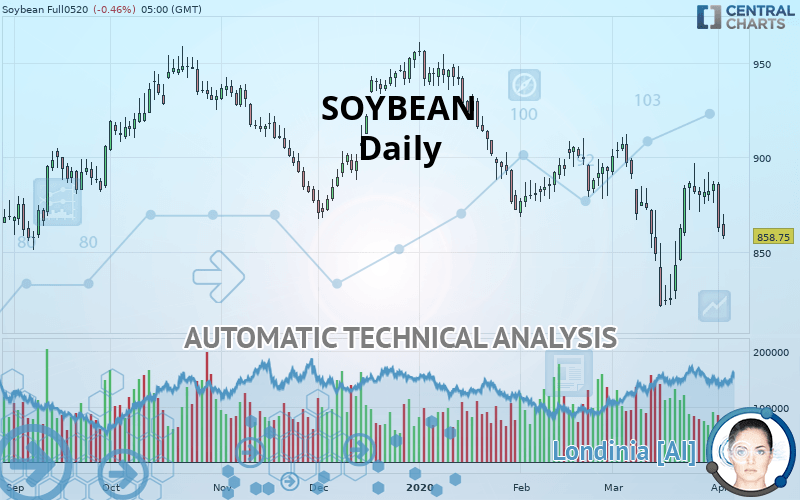
SOYBEAN - Daily - Technical analysis published on 04/03/2020 (GMT)
- Who voted?
- 310
- 0
Click here for a new analysis!
- Timeframe : Daily
- - Analysis generated on
- Status : TARGET REACHED
Summary of the analysis

Additional analysis
Quotes
The SOYBEAN rating is 858.75 USD. On the day, this instrument lost -0.46% with the lowest point at 857.00 USD and the highest point at 870.00 USD. The deviation from the price is +0.20% for the low point and -1.29% for the high point.A bearish opening was detected by the Central Gaps scanner. Sellers are trying to impose a bearish trend in the very short term.
Bearish opening
Type : Bearish
Timeframe : Openning
Here is a more detailed summary of the historical variations registered by SOYBEAN:
Near a new LOW record (1st january)
Type : Bearish
Timeframe : Weekly
Technical
Technical analysis of SOYBEAN in Daily shows a overall strongly bearish trend. The signals given by moving averages are 92.86% bearish. This strong bearish trend is confirmed by the strong signals currently being given by short-term moving averages. The Central Indicators scanner detects bearish signals on moving averages that could impact this trend:
Bearish price crossover with Moving Average 20
Type : Bearish
Timeframe : Daily
Bearish price crossover with Moving Average 50
Type : Bearish
Timeframe : Daily
Bearish price crossover with adaptative moving average 20
Type : Bearish
Timeframe : Daily
Bearish price crossover with adaptative moving average 50
Type : Bearish
Timeframe : Daily
On the 18 technical indicators analysed, 7 are bullish, 6 are neutral and 5 are bearish. But beware of excesses. The Central Indicators scanner currently detects this:
RSI indicator: bearish divergence
Type : Bearish
Timeframe : Daily
Pivot points : price is over resistance 1
Type : Neutral
Timeframe : Weekly
Pivot points : price is under support 3
Type : Neutral
Timeframe : Daily
RSI indicator is back under 50
Type : Bearish
Timeframe : Daily
Ichimoku - Bullish crossover : Tenkan & Kijun
Type : Bullish
Timeframe : Daily
Price is back over the pivot point
Type : Bullish
Timeframe : Daily
No signals are given by Central Patterns, a market scanner specialised in chart patterns, resistances and supports.
The Central Candlesticks scanner which studies Japanese candlesticks did not detect anything.
| S3 | S2 | S1 | Price | R1 | R2 | R3 | |
|---|---|---|---|---|---|---|---|
| ProTrendLines | 804.80 | 821.75 | 856.70 | 858.75 | 870.90 | 886.75 | 908.45 |
| Change (%) | -6.28% | -4.31% | -0.24% | - | +1.41% | +3.26% | +5.79% |
| Change | -53.95 | -37.00 | -2.05 | - | +12.15 | +28.00 | +49.70 |
| Level | Major | Minor | Major | - | Major | Major | Intermediate |
Pivot points can also be used to set your price objectives. Here is the price situation in relation to pivot points:
| Pivot points | S3 | S2 | S1 | PP | R1 | R2 | R3 |
|---|---|---|---|---|---|---|---|
| Standard | 866.92 | 871.33 | 878.67 | 883.08 | 890.42 | 894.83 | 902.17 |
| Camarilla | 882.77 | 883.85 | 884.92 | 886.00 | 887.08 | 888.15 | 889.23 |
| Woodie | 868.38 | 872.06 | 880.13 | 883.81 | 891.88 | 895.56 | 903.63 |
| Fibonacci | 871.33 | 875.82 | 878.60 | 883.08 | 887.57 | 890.35 | 894.83 |
| Pivot points | S3 | S2 | S1 | PP | R1 | R2 | R3 |
|---|---|---|---|---|---|---|---|
| Standard | 790.33 | 805.67 | 834.08 | 849.42 | 877.83 | 893.17 | 921.58 |
| Camarilla | 850.47 | 854.48 | 858.49 | 862.50 | 866.51 | 870.52 | 874.53 |
| Woodie | 796.88 | 808.94 | 840.63 | 852.69 | 884.38 | 896.44 | 928.13 |
| Fibonacci | 805.67 | 822.38 | 832.70 | 849.42 | 866.13 | 876.45 | 893.17 |
| Pivot points | S3 | S2 | S1 | PP | R1 | R2 | R3 |
|---|---|---|---|---|---|---|---|
| Standard | 829.42 | 849.08 | 870.92 | 890.58 | 912.42 | 932.08 | 953.92 |
| Camarilla | 881.34 | 885.14 | 888.95 | 892.75 | 896.55 | 900.36 | 904.16 |
| Woodie | 830.50 | 849.63 | 872.00 | 891.13 | 913.50 | 932.63 | 955.00 |
| Fibonacci | 849.08 | 864.94 | 874.73 | 890.58 | 906.44 | 916.23 | 932.08 |
Numerical data
The following is the status of the technical indicators and moving averages at the time of publication of this technical analysis:
| RSI (14): | 44.13 | |
| MACD (12,26,9): | -2.3200 | |
| Directional Movement: | -2.93 | |
| AROON (14): | 50.00 | |
| DEMA (21): | 868.34 | |
| Parabolic SAR (0,02-0,02-0,2): | 844.09 | |
| Elder Ray (13): | 1.30 | |
| Super Trend (3,10): | 832.85 | |
| Zig ZAG (10): | 862.75 | |
| VORTEX (21): | 0.8900 | |
| Stochastique (14,3,5): | 73.68 | |
| TEMA (21): | 873.13 | |
| Williams %R (14): | -45.07 | |
| Chande Momentum Oscillator (20): | 41.00 | |
| Repulse (5,40,3): | -2.7100 | |
| ROCnROLL: | 2 | |
| TRIX (15,9): | -0.1000 | |
| Courbe Coppock: | 2.74 |
| MA7: | 880.14 | |
| MA20: | 866.91 | |
| MA50: | 882.37 | |
| MA100: | 900.87 | |
| MAexp7: | 874.65 | |
| MAexp20: | 873.36 | |
| MAexp50: | 883.67 | |
| MAexp100: | 893.14 | |
| Price / MA7: | -2.43% | |
| Price / MA20: | -0.94% | |
| Price / MA50: | -2.68% | |
| Price / MA100: | -4.68% | |
| Price / MAexp7: | -1.82% | |
| Price / MAexp20: | -1.67% | |
| Price / MAexp50: | -2.82% | |
| Price / MAexp100: | -3.85% |
News
Don"t forget to follow the news on SOYBEAN. At the time of publication of this analysis, the latest news was as follows:
-
 Ahead Of Trump-Xi Meeting, USDA Announces Huge Soybean Sale To China
-
Soybean farmer: We would like to have markets, not aid
-
Impact of tariffs on America's soybean farmers
-
Will Trump's Truce With China Help Soybean Sales?
-
U.S. Trade Gap Hits 10-Year High In October As Soybean Exports Continue To Fall
About author

Online


Add a comment
Comments
0 comments on the analysis SOYBEAN - Daily