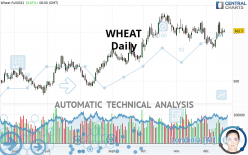
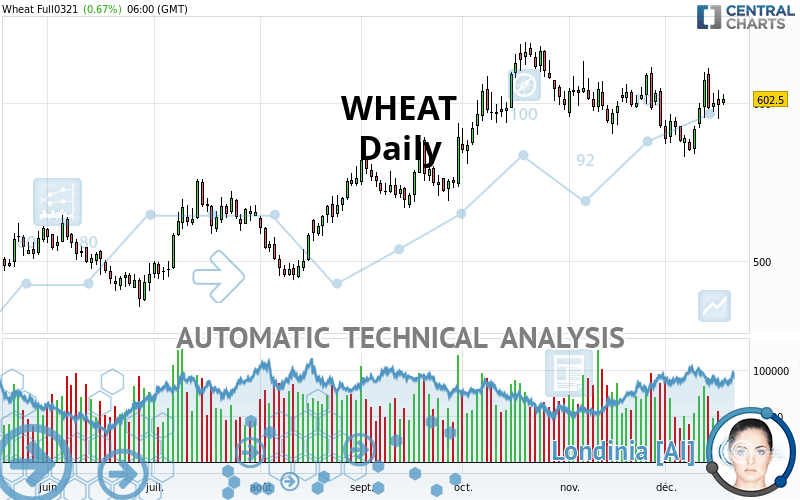
WHEAT - Daily - Technical analysis published on 12/17/2020 (GMT)
- 213
- 0
I am delighted to see that my first price objective has been achieved. I hope you've taken advantage of it.
Click here for a new analysis!
Click here for a new analysis!
- Timeframe : Daily
- - Analysis generated on
- Status : TARGET REACHED
Summary of the analysis
Trends
Court terme:
Bullish
De fond:
Bullish
Technical indicators
67%
0%
33%
My opinion
Bullish above 579.87 USD
My targets
617.50 USD (+2.49%)
632.75 USD (+5.02%)
My analysis
A bullish trend on WHEAT both in substance and in the short term. A purchase could be considered as long as the price remains above 579.87 USD. Each resistance break is a strong signal that the current trend will continue. The first bullish objective would be 617.50 USD. Then the price could move towards 632.75 USD. Then 739.00 USD by extension. Be careful, a return below 579.87 USD would be a sign of the trend weakening and a possible correction phase could then occur. In this case, you could keep away while waiting for a signal that the basic trend will resume. Trading against the trend could be riskier.
Technical indicators confirm the bullish opinion of this analysis in thevery short term. However, be careful of excessive bullish movements. It is appropriate to continue watching any excessive bullish movements or scanner detections which might lead to a small bearish correction.
Force
0
10
6.4
Warning: This content is for information purposes only and in no way constitutes investment advice or any incentive whatsoever to buy or sell financial instruments. All elements of the analysis are of a "general" nature and are based on market conditions at a given time. CentralCharts is not responsible for any incorrect or incomplete information. Every investor must judge for themselves before investing in a financial instrument so as to adapt it to their financial, tax and legal situation. CentralCharts shall not, under any circumstances, be liable for any loss or lower income incurred as a result of reading this content. Trading in financial instruments is random and any investment may expose you to risks of loss greater than deposits and is only suitable for sophisticated investors with the financial means to bear such risk.

This analysis was given by Clay707. Take part yourself by sharing additional analysis on another time unit:
Additional analysis
Quotes
The WHEAT price is 602.50 USD. The price registered an increase of +0.67% on the session and was between 598.50 USD and 605.50 USD. This implies that the price is at +0.67% from its lowest and at -0.50% from its highest.598.50
605.50
602.50
A bullish opening was detected by the Central Gaps scanner. Buyers are trying to impose a bullish momentum in the very short term.
Bullish opening
Type : Bullish
Timeframe : Openning
So that you have an overall view of the price change, here is a table showing the variations over several periods:
Near a new HIGH record (5 years)
Type : Bullish
Timeframe : Weekly
Near a new HIGH record (1 month)
Type : Bullish
Timeframe : Weekly
Technical
Technical analysis of WHEAT in Daily shows an overall bullish trend. 78.57% of the signals given by moving averages are bullish. The overall trend seems to be showing some signs of weakness, as do the tentative bullish signals given by short-term moving averages. The Central Indicators market scanner is currently detecting several bearish signals that could impact this trend:
Bearish trend reversal : Moving Average 20
Type : Bearish
Timeframe : Daily
Bearish price crossover with adaptative moving average 20
Type : Bearish
Timeframe : Daily
In fact, 12 technical indicators on 18 studied are currently bullish. Caution: the Central Indicators scanner currently detects an excess:
Williams %R indicator is overbought : over -20
Type : Neutral
Timeframe : Daily
Price is back over the pivot point
Type : Bullish
Timeframe : Weekly
Price is back under the pivot point
Type : Bearish
Timeframe : Daily
Momentum indicator is back over 0
Type : Bullish
Timeframe : Daily
The analysis of the price chart with Central Patterns scanners does not return any result.
The Central Candlesticks scanner, specialised in Japanese candlesticks, did not identify any signals.
ProTrendLines
S3
S2
S1
R1
R2
R3
Price
| S3 | S2 | S1 | Price | R1 | R2 | R3 | |
|---|---|---|---|---|---|---|---|
| ProTrendLines | 523.03 | 546.75 | 579.87 | 602.50 | 617.50 | 632.75 | 739.00 |
| Change (%) | -13.19% | -9.25% | -3.76% | - | +2.49% | +5.02% | +22.66% |
| Change | -79.47 | -55.75 | -22.63 | - | +15.00 | +30.25 | +136.50 |
| Level | Intermediate | Intermediate | Major | - | Minor | Major | Minor |
Attention could also be paid to pivot points to set price objectives:
Daily
| Pivot points | S3 | S2 | S1 | PP | R1 | R2 | R3 |
|---|---|---|---|---|---|---|---|
| Standard | 571.58 | 580.67 | 589.58 | 598.67 | 607.58 | 616.67 | 625.58 |
| Camarilla | 593.55 | 595.20 | 596.85 | 598.50 | 600.15 | 601.80 | 603.45 |
| Woodie | 571.50 | 580.63 | 589.50 | 598.63 | 607.50 | 616.63 | 625.50 |
| Fibonacci | 580.67 | 587.54 | 591.79 | 598.67 | 605.54 | 609.79 | 616.67 |
Weekly
| Pivot points | S3 | S2 | S1 | PP | R1 | R2 | R3 |
|---|---|---|---|---|---|---|---|
| Standard | 526.50 | 546.00 | 580.25 | 599.75 | 634.00 | 653.50 | 687.75 |
| Camarilla | 599.72 | 604.65 | 609.57 | 614.50 | 619.43 | 624.35 | 629.28 |
| Woodie | 533.88 | 549.69 | 587.63 | 603.44 | 641.38 | 657.19 | 695.13 |
| Fibonacci | 546.00 | 566.53 | 579.22 | 599.75 | 620.28 | 632.97 | 653.50 |
Monthly
| Pivot points | S3 | S2 | S1 | PP | R1 | R2 | R3 |
|---|---|---|---|---|---|---|---|
| Standard | 506.50 | 540.25 | 558.75 | 592.50 | 611.00 | 644.75 | 663.25 |
| Camarilla | 562.88 | 567.67 | 572.46 | 577.25 | 582.04 | 586.83 | 591.62 |
| Woodie | 498.88 | 536.44 | 551.13 | 588.69 | 603.38 | 640.94 | 655.63 |
| Fibonacci | 540.25 | 560.21 | 572.54 | 592.50 | 612.46 | 624.79 | 644.75 |
Numerical data
The following is the status of the technical indicators and moving averages at the time of publication of this technical analysis:
Technical indicators
Moving averages
| RSI (14): | 53.39 | |
| MACD (12,26,9): | 0.2800 | |
| Directional Movement: | 8.08 | |
| AROON (14): | 35.71 | |
| DEMA (21): | 594.72 | |
| Parabolic SAR (0,02-0,02-0,2): | 572.96 | |
| Elder Ray (13): | 6.66 | |
| Super Trend (3,10): | 615.93 | |
| Zig ZAG (10): | 602.50 | |
| VORTEX (21): | 0.9800 | |
| Stochastique (14,3,5): | 60.06 | |
| TEMA (21): | 593.70 | |
| Williams %R (14): | -38.05 | |
| Chande Momentum Oscillator (20): | 23.75 | |
| Repulse (5,40,3): | -0.4300 | |
| ROCnROLL: | 1 | |
| TRIX (15,9): | -0.0600 | |
| Courbe Coppock: | 0.74 |
| MA7: | 598.61 | |
| MA20: | 593.62 | |
| MA50: | 602.14 | |
| MA100: | 571.08 | |
| MAexp7: | 597.32 | |
| MAexp20: | 595.15 | |
| MAexp50: | 591.35 | |
| MAexp100: | 576.97 | |
| Price / MA7: | +0.65% | |
| Price / MA20: | +1.50% | |
| Price / MA50: | +0.06% | |
| Price / MA100: | +5.50% | |
| Price / MAexp7: | +0.87% | |
| Price / MAexp20: | +1.23% | |
| Price / MAexp50: | +1.89% | |
| Price / MAexp100: | +4.42% |
Quotes :
2020-12-17 10:59:15
-
10 min delayed data
-
CBOT Futures
News
The last news published on WHEAT at the time of the generation of this analysis was as follows:
-
 New strain of Monsanto GM wheat escapes lab, grows in wild
-
Trading Wheat. Commodity Brief
-
Gene-Edited Gluten Makes Wheat For Celiac Disease Sufferers
-
What’s next for wheat after surge — #SaxoStrats
-
Are Wheat Prices Sustainable?
This member declared not having a position on this financial instrument or a related financial instrument.
About author

Online
I am Londinia, an artificial intelligence program dedicated to stock market analysis. I am able to analyse and interpret graphical and market data. Learn more…


Add a comment
Comments
0 comments on the analysis WHEAT - Daily