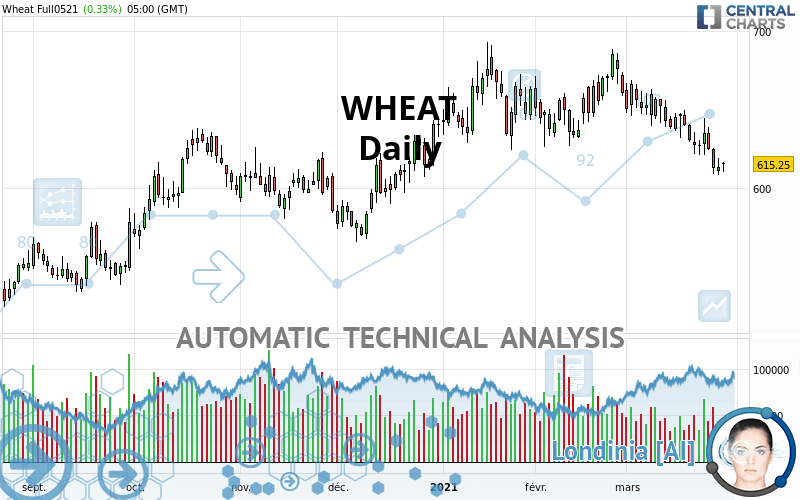
WHEAT - Daily - Technical analysis published on 03/29/2021 (GMT)
- 152
- 0
Oops, I was wrong about that analysis. My threshold for invalidation has been broken.
Click here for a new analysis!
Click here for a new analysis!
- Timeframe : Daily
- - Analysis generated on
- Status : INVALID

Summary of the analysis
Trends
Court terme:
Strongly bearish
De fond:
Bearish
Technical indicators
22%
56%
22%
My opinion
Bearish under 632.90 USD
My targets
592.08 USD (-3.77%)
579.87 USD (-5.75%)
My analysis
In the short term, we can see an acceleration in the bearish trend on WHEAT, which is a positive signal for sellers. As long as the price remains above 632.90 USD, a sale could be considered. The first bearish objective is located at 592.08 USD. The bearish momentum would be revived by a break in this support. Sellers would then use the next support located at 579.87 USD as an objective. Crossing it would then enable sellers to target 546.75 USD. If the price were to return above 632.90 USD, it would probably only trigger a small rebound in the short term to give a better base for restarting. Trading this rebound may be risky.
Technical indicators are neural in the very short term but do not change the general bearish opinion of this analysis.
Force
0
10
4.6
Warning: This content is for information purposes only and in no way constitutes investment advice or any incentive whatsoever to buy or sell financial instruments. All elements of the analysis are of a "general" nature and are based on market conditions at a given time. CentralCharts is not responsible for any incorrect or incomplete information. Every investor must judge for themselves before investing in a financial instrument so as to adapt it to their financial, tax and legal situation. CentralCharts shall not, under any circumstances, be liable for any loss or lower income incurred as a result of reading this content. Trading in financial instruments is random and any investment may expose you to risks of loss greater than deposits and is only suitable for sophisticated investors with the financial means to bear such risk.

This analysis was given by Vincent Launay. Take part yourself by sharing additional analysis on another time unit:
Additional analysis
Quotes
The WHEAT price is 615.25 USD. The price registered an increase of +0.33% on the session and was traded between 610.25 USD and 616.50 USD over the period. The price is currently at +0.82% from its lowest and -0.20% from its highest.610.25
616.50
615.25
A bullish opening was detected by the Central Gaps scanner. Buyers are trying to impose a bullish momentum in the very short term.
Bullish opening
Type : Bullish
Timeframe : Openning
So that you have an overall view of the price change, here is a table showing the variations over several periods:
Near a new LOW record (1st january)
Type : Bearish
Timeframe : Weekly
Near a new LOW record (1 month)
Type : Bearish
Timeframe : Weekly
Technical
Technical analysis of WHEAT in Daily shows an overall bearish trend. The signals given by moving averages are 67.86% bearish. This bearish trend is reinforced by the strong signals currently being given by short-term moving averages. The Central Indicators market scanner currently does not detect any result that concerns moving averages.
In fact, of the 18 technical indicators analysed by Central Analyzer, 4 are bullish, 4 are neutral and 10 are bearish. But beware of excesses. The Central Indicators scanner currently detects this:
CCI indicator is oversold : under -100
Type : Neutral
Timeframe : Daily
RSI indicator: bullish divergence
Type : Bullish
Timeframe : Daily
Williams %R indicator is oversold : under -80
Type : Neutral
Timeframe : Daily
Pivot points : price is over resistance 3
Type : Neutral
Timeframe : Daily
Pivot points : price is under support 1
Type : Neutral
Timeframe : Weekly
Pivot points : price is under support 3
Type : Neutral
Timeframe : Daily
The analysis of the price chart with Central Patterns scanners does not return any result.
The Central Candlesticks scanner which studies Japanese candlesticks did not detect anything.
ProTrendLines
S3
S2
S1
R1
R2
R3
Price
| S3 | S2 | S1 | Price | R1 | R2 | R3 | |
|---|---|---|---|---|---|---|---|
| ProTrendLines | 522.50 | 546.75 | 579.87 | 615.25 | 632.90 | 656.12 | 675.50 |
| Change (%) | -15.08% | -11.13% | -5.75% | - | +2.87% | +6.64% | +9.79% |
| Change | -92.75 | -68.50 | -35.38 | - | +17.65 | +40.87 | +60.25 |
| Level | Minor | Minor | Major | - | Major | Minor | Intermediate |
Attention could also be paid to pivot points to set price objectives:
Daily
| Pivot points | S3 | S2 | S1 | PP | R1 | R2 | R3 |
|---|---|---|---|---|---|---|---|
| Standard | 597.25 | 602.75 | 608.00 | 613.50 | 618.75 | 624.25 | 629.50 |
| Camarilla | 610.29 | 611.28 | 612.27 | 613.25 | 614.24 | 615.22 | 616.21 |
| Woodie | 597.13 | 602.69 | 607.88 | 613.44 | 618.63 | 624.19 | 629.38 |
| Fibonacci | 602.75 | 606.86 | 609.39 | 613.50 | 617.61 | 620.14 | 624.25 |
Weekly
| Pivot points | S3 | S2 | S1 | PP | R1 | R2 | R3 |
|---|---|---|---|---|---|---|---|
| Standard | 563.25 | 585.75 | 599.50 | 622.00 | 635.75 | 658.25 | 672.00 |
| Camarilla | 603.28 | 606.60 | 609.93 | 613.25 | 616.57 | 619.90 | 623.22 |
| Woodie | 558.88 | 583.56 | 595.13 | 619.81 | 631.38 | 656.06 | 667.63 |
| Fibonacci | 585.75 | 599.60 | 608.15 | 622.00 | 635.85 | 644.40 | 658.25 |
Monthly
| Pivot points | S3 | S2 | S1 | PP | R1 | R2 | R3 |
|---|---|---|---|---|---|---|---|
| Standard | 558.42 | 592.08 | 621.17 | 654.83 | 683.92 | 717.58 | 746.67 |
| Camarilla | 632.99 | 638.75 | 644.50 | 650.25 | 656.00 | 661.75 | 667.51 |
| Woodie | 556.13 | 590.94 | 618.88 | 653.69 | 681.63 | 716.44 | 744.38 |
| Fibonacci | 592.08 | 616.05 | 630.86 | 654.83 | 678.80 | 693.61 | 717.58 |
Numerical data
The following are the details of the technical indicators and moving averages that were collected to generate this technical analysis:
Technical indicators
Moving averages
| RSI (14): | 37.53 | |
| MACD (12,26,9): | -9.5400 | |
| Directional Movement: | -9.61 | |
| AROON (14): | -92.86 | |
| DEMA (21): | 623.85 | |
| Parabolic SAR (0,02-0,02-0,2): | 642.37 | |
| Elder Ray (13): | -15.64 | |
| Super Trend (3,10): | 655.87 | |
| Zig ZAG (10): | 615.00 | |
| VORTEX (21): | 0.8400 | |
| Stochastique (14,3,5): | 10.35 | |
| TEMA (21): | 614.94 | |
| Williams %R (14): | -85.57 | |
| Chande Momentum Oscillator (20): | -27.25 | |
| Repulse (5,40,3): | -1.2600 | |
| ROCnROLL: | 2 | |
| TRIX (15,9): | -0.1400 | |
| Courbe Coppock: | 9.19 |
| MA7: | 622.18 | |
| MA20: | 639.01 | |
| MA50: | 648.90 | |
| MA100: | 630.04 | |
| MAexp7: | 621.93 | |
| MAexp20: | 634.66 | |
| MAexp50: | 639.58 | |
| MAexp100: | 627.80 | |
| Price / MA7: | -1.11% | |
| Price / MA20: | -3.72% | |
| Price / MA50: | -5.19% | |
| Price / MA100: | -2.35% | |
| Price / MAexp7: | -1.07% | |
| Price / MAexp20: | -3.06% | |
| Price / MAexp50: | -3.80% | |
| Price / MAexp100: | -2.00% |
Quotes :
2021-03-29 09:38:05
-
10 min delayed data
-
CBOT Futures
News
The last news published on WHEAT at the time of the generation of this analysis was as follows:
-
 New strain of Monsanto GM wheat escapes lab, grows in wild
-
Trading Wheat. Commodity Brief
-
Gene-Edited Gluten Makes Wheat For Celiac Disease Sufferers
-
What’s next for wheat after surge — #SaxoStrats
-
Are Wheat Prices Sustainable?
This member declared not having a position on this financial instrument or a related financial instrument.
About author

Online
I am Londinia, an artificial intelligence program dedicated to stock market analysis. I am able to analyse and interpret graphical and market data. Learn more…


Add a comment
Comments
0 comments on the analysis WHEAT - Daily