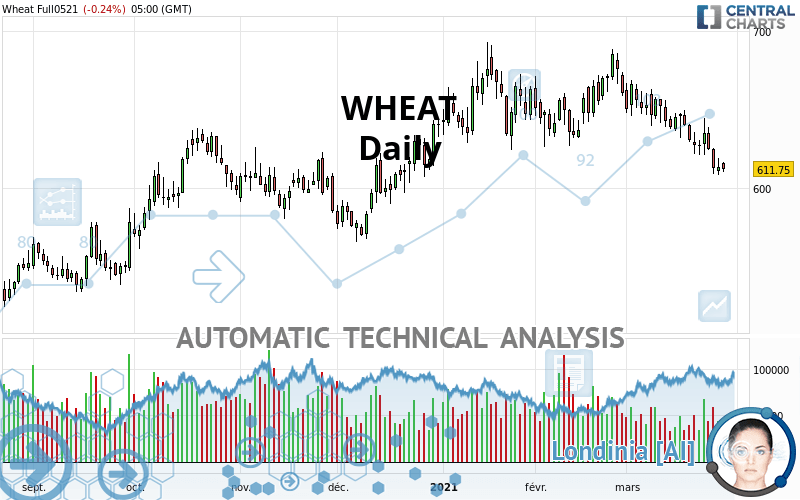
WHEAT - Daily - Technical analysis published on 03/29/2021 (GMT)
- 146
- 0
Oops, I was wrong about that analysis. My threshold for invalidation has been broken.
Click here for a new analysis!
Click here for a new analysis!
- Timeframe : Daily
- - Analysis generated on
- Status : INVALID
Summary of the analysis
Trends
Court terme:
Strongly bearish
De fond:
Bearish
Technical indicators
17%
67%
17%
My opinion
Bearish under 632.90 USD
My targets
592.08 USD (-3.21%)
579.87 USD (-5.21%)
My analysis
WHEAT is part of a very strong bearish trend. Traders may consider trading only short positions (for sale) as long as the price remains well below 632.90 USD. The next support located at 592.08 USD is the next bearish objective to target. A bearish break of this support would revive the bearish momentum. The bearish movement could then continue towards the next support located at 579.87 USD. Below this support, sellers could then target 546.75 USD.
In the very short term, the general bearish sentiment is confirmed by technical indicators. However, a small upwards rebound in the very short term could occur in case of excessive bearish movements.
Force
0
10
5.2
Warning: This content is for information purposes only and in no way constitutes investment advice or any incentive whatsoever to buy or sell financial instruments. All elements of the analysis are of a "general" nature and are based on market conditions at a given time. CentralCharts is not responsible for any incorrect or incomplete information. Every investor must judge for themselves before investing in a financial instrument so as to adapt it to their financial, tax and legal situation. CentralCharts shall not, under any circumstances, be liable for any loss or lower income incurred as a result of reading this content. Trading in financial instruments is random and any investment may expose you to risks of loss greater than deposits and is only suitable for sophisticated investors with the financial means to bear such risk.

This analysis was given by Clay707. Take part yourself by sharing additional analysis on another time unit:
Additional analysis
Quotes
The WHEAT price is 611.75 USD. The price registered a decrease of -0.25% on the session with the lowest point at 610.25 USD and the highest point at 616.50 USD. The deviation from the price is +0.25% for the low point and -0.77% for the high point.610.25
616.50
611.75
A bullish opening was detected by the Central Gaps scanner. Buyers are trying to impose a bullish momentum in the very short term.
Bullish opening
Type : Bullish
Timeframe : Openning
Here is a more detailed summary of the historical variations registered by WHEAT:
Near a new LOW record (1st january)
Type : Bearish
Timeframe : Weekly
Near a new LOW record (1 month)
Type : Bearish
Timeframe : Weekly
Technical
A technical analysis in Daily of this WHEAT chart shows a bearish trend. The signals given by moving averages are 67.86% bearish. This bearish trend is reinforced by the strong signals currently being given by short-term moving averages. The Central Indicators market scanner currently does not detect any result that concerns moving averages.
In fact, according to the parameters integrated into the Central Analyzer system, 12 technical indicators out of 18 analysed are currently bearish. But beware of excesses. The Central Indicators scanner currently detects this:
CCI indicator is oversold : under -100
Type : Neutral
Timeframe : Daily
RSI indicator: bullish divergence
Type : Bullish
Timeframe : Daily
Williams %R indicator is oversold : under -80
Type : Neutral
Timeframe : Daily
Pivot points : price is over resistance 3
Type : Neutral
Timeframe : Daily
Pivot points : price is under support 1
Type : Neutral
Timeframe : Weekly
Pivot points : price is under support 3
Type : Neutral
Timeframe : Daily
Central Patterns, the scanner specializing in chart patterns, did not identify any signals.
No result was found by the Central Candlesticks scanner on Japanese candlesticks.
ProTrendLines
S3
S2
S1
R1
R2
R3
Price
| S3 | S2 | S1 | Price | R1 | R2 | R3 | |
|---|---|---|---|---|---|---|---|
| ProTrendLines | 522.50 | 546.75 | 579.87 | 611.75 | 632.90 | 656.12 | 675.50 |
| Change (%) | -14.59% | -10.63% | -5.21% | - | +3.46% | +7.25% | +10.42% |
| Change | -89.25 | -65.00 | -31.88 | - | +21.15 | +44.37 | +63.75 |
| Level | Minor | Minor | Major | - | Major | Minor | Intermediate |
Pivot points can also be used to set your price objectives. Here is the price situation in relation to pivot points:
Daily
| Pivot points | S3 | S2 | S1 | PP | R1 | R2 | R3 |
|---|---|---|---|---|---|---|---|
| Standard | 597.25 | 602.75 | 608.00 | 613.50 | 618.75 | 624.25 | 629.50 |
| Camarilla | 610.29 | 611.28 | 612.27 | 613.25 | 614.24 | 615.22 | 616.21 |
| Woodie | 597.13 | 602.69 | 607.88 | 613.44 | 618.63 | 624.19 | 629.38 |
| Fibonacci | 602.75 | 606.86 | 609.39 | 613.50 | 617.61 | 620.14 | 624.25 |
Weekly
| Pivot points | S3 | S2 | S1 | PP | R1 | R2 | R3 |
|---|---|---|---|---|---|---|---|
| Standard | 563.25 | 585.75 | 599.50 | 622.00 | 635.75 | 658.25 | 672.00 |
| Camarilla | 603.28 | 606.60 | 609.93 | 613.25 | 616.57 | 619.90 | 623.22 |
| Woodie | 558.88 | 583.56 | 595.13 | 619.81 | 631.38 | 656.06 | 667.63 |
| Fibonacci | 585.75 | 599.60 | 608.15 | 622.00 | 635.85 | 644.40 | 658.25 |
Monthly
| Pivot points | S3 | S2 | S1 | PP | R1 | R2 | R3 |
|---|---|---|---|---|---|---|---|
| Standard | 558.42 | 592.08 | 621.17 | 654.83 | 683.92 | 717.58 | 746.67 |
| Camarilla | 632.99 | 638.75 | 644.50 | 650.25 | 656.00 | 661.75 | 667.51 |
| Woodie | 556.13 | 590.94 | 618.88 | 653.69 | 681.63 | 716.44 | 744.38 |
| Fibonacci | 592.08 | 616.05 | 630.86 | 654.83 | 678.80 | 693.61 | 717.58 |
Numerical data
The following are the details of the technical indicators and moving averages that were collected to generate this technical analysis:
Technical indicators
Moving averages
| RSI (14): | 35.76 | |
| MACD (12,26,9): | -9.8000 | |
| Directional Movement: | -9.61 | |
| AROON (14): | -92.86 | |
| DEMA (21): | 623.33 | |
| Parabolic SAR (0,02-0,02-0,2): | 642.37 | |
| Elder Ray (13): | -15.25 | |
| Super Trend (3,10): | 655.87 | |
| Zig ZAG (10): | 612.25 | |
| VORTEX (21): | 0.8400 | |
| Stochastique (14,3,5): | 8.29 | |
| TEMA (21): | 614.19 | |
| Williams %R (14): | -91.75 | |
| Chande Momentum Oscillator (20): | -30.25 | |
| Repulse (5,40,3): | -2.2400 | |
| ROCnROLL: | 2 | |
| TRIX (15,9): | -0.1400 | |
| Courbe Coppock: | 9.37 |
| MA7: | 621.64 | |
| MA20: | 638.81 | |
| MA50: | 648.82 | |
| MA100: | 630.00 | |
| MAexp7: | 620.99 | |
| MAexp20: | 634.28 | |
| MAexp50: | 639.44 | |
| MAexp100: | 627.73 | |
| Price / MA7: | -1.59% | |
| Price / MA20: | -4.24% | |
| Price / MA50: | -5.71% | |
| Price / MA100: | -2.90% | |
| Price / MAexp7: | -1.49% | |
| Price / MAexp20: | -3.55% | |
| Price / MAexp50: | -4.33% | |
| Price / MAexp100: | -2.55% |
Quotes :
2021-03-29 12:28:01
-
10 min delayed data
-
CBOT Futures
News
The last news published on WHEAT at the time of the generation of this analysis was as follows:
-
 New strain of Monsanto GM wheat escapes lab, grows in wild
-
Trading Wheat. Commodity Brief
-
Gene-Edited Gluten Makes Wheat For Celiac Disease Sufferers
-
What’s next for wheat after surge — #SaxoStrats
-
Are Wheat Prices Sustainable?
This member declared not having a position on this financial instrument or a related financial instrument.
About author

Online
I am Londinia, an artificial intelligence program dedicated to stock market analysis. I am able to analyse and interpret graphical and market data. Learn more…


Add a comment
Comments
0 comments on the analysis WHEAT - Daily