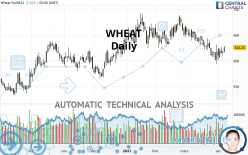
WHEAT - Daily - Technical analysis published on 04/08/2021 (GMT)
- 158
- 0
- Timeframe : Daily
- - Analysis generated on
- Status : NEUTRAL
Summary of the analysis
Trends
Court terme:
Neutral
De fond:
Neutral
Technical indicators
39%
17%
44%
My opinion
Neutral between 624.33 USD and 632.90 USD
My targets
-
My analysis
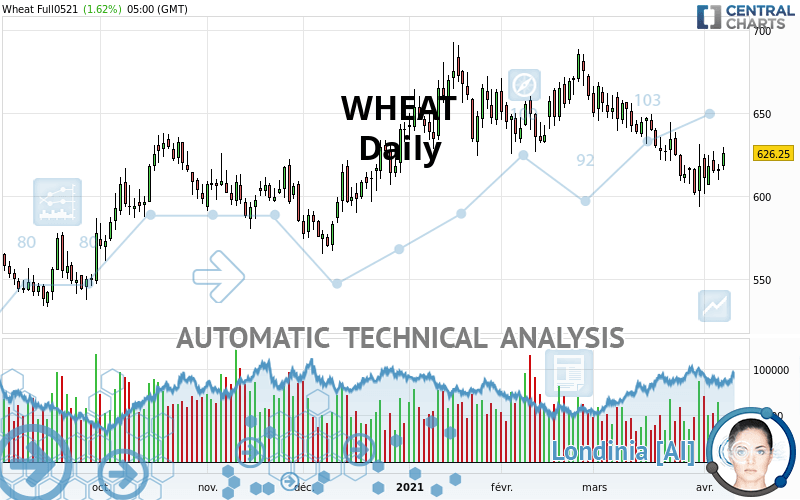
The short-term and basic trend is neutral. In this situation, the price of WHEAT could just as easily move towards the first resistance as the first support. No statistical advantage is given for one of these levels to be achieved before the other. It will be necessary to create a new automated analysis when the conditions have progressed. This may be the case, for example, when the first resistance has been broken above or the first support has been broken below. The first resistance is located at 632.90 USD. The first support is located at 624.33 USD.
In the very short term, technical indicators are bullish and could soon allow change to a bullish sentiment.
Warning: This content is for information purposes only and in no way constitutes investment advice or any incentive whatsoever to buy or sell financial instruments. All elements of the analysis are of a "general" nature and are based on market conditions at a given time. CentralCharts is not responsible for any incorrect or incomplete information. Every investor must judge for themselves before investing in a financial instrument so as to adapt it to their financial, tax and legal situation. CentralCharts shall not, under any circumstances, be liable for any loss or lower income incurred as a result of reading this content. Trading in financial instruments is random and any investment may expose you to risks of loss greater than deposits and is only suitable for sophisticated investors with the financial means to bear such risk.

This analysis was given by Clay707. Take part yourself by sharing additional analysis on another time unit:
Additional analysis
Quotes
The WHEAT price is 626.25 USD. On the day, this instrument gained +1.62% and was between 616.00 USD and 629.75 USD. This implies that the price is at +1.66% from its lowest and at -0.56% from its highest.616.00
629.75
626.25
The Central Gaps scanner detects a bullish opening. A small advantage for buyers in the very short term.
Bullish opening
Type : Bullish
Timeframe : Openning
So that you have an overall view of the price change, here is a table showing the variations over several periods:
Near a new LOW record (1st january)
Type : Bearish
Timeframe : Weekly
Near a new LOW record (1 month)
Type : Bearish
Timeframe : Weekly
Technical
Technical analysis of WHEAT in Daily shows a neutral overall trend. This generally neutral trend is confirmed by the neutral signals currently given by short-term moving averages. An assessment of moving averages reveals a bearish signal that could impact this trend:
Moving Average bearish crossovers : AMA20 & AMA50
Type : Bearish
Timeframe : Daily
In fact, according to the parameters integrated into the Central Analyzer system, only 7 technical indicators out of 18 analysed are currently bullish. But beware of excesses. The Central Indicators scanner currently detects this:
CCI indicator: bullish divergence
Type : Bullish
Timeframe : Daily
MACD indicator: bullish divergence
Type : Bullish
Timeframe : Daily
Williams %R indicator is overbought : over -20
Type : Neutral
Timeframe : Daily
Pivot points : price is over resistance 3
Type : Neutral
Timeframe : Daily
Pivot points : price is under support 1
Type : Neutral
Timeframe : Weekly
Pivot points : price is under support 3
Type : Neutral
Timeframe : Daily
The analysis of the price chart with Central Patterns scanners does not return any result.
The Central Candlesticks scanner which studies Japanese candlesticks did not detect anything.
ProTrendLines
S3
S2
S1
R1
R2
R3
Price
| S3 | S2 | S1 | Price | R1 | R2 | R3 | |
|---|---|---|---|---|---|---|---|
| ProTrendLines | 491.00 | 546.75 | 579.87 | 626.25 | 632.90 | 656.12 | 685.50 |
| Change (%) | -21.60% | -12.69% | -7.41% | - | +1.06% | +4.77% | +9.46% |
| Change | -135.25 | -79.50 | -46.38 | - | +6.65 | +29.87 | +59.25 |
| Level | Intermediate | Intermediate | Major | - | Major | Minor | Intermediate |
Attention could also be paid to pivot points to set price objectives:
Daily
| Pivot points | S3 | S2 | S1 | PP | R1 | R2 | R3 |
|---|---|---|---|---|---|---|---|
| Standard | 600.75 | 605.25 | 610.75 | 615.25 | 620.75 | 625.25 | 630.75 |
| Camarilla | 613.50 | 614.42 | 615.33 | 616.25 | 617.17 | 618.08 | 619.00 |
| Woodie | 601.25 | 605.50 | 611.25 | 615.50 | 621.25 | 625.50 | 631.25 |
| Fibonacci | 605.25 | 609.07 | 611.43 | 615.25 | 619.07 | 621.43 | 625.25 |
Weekly
| Pivot points | S3 | S2 | S1 | PP | R1 | R2 | R3 |
|---|---|---|---|---|---|---|---|
| Standard | 553.75 | 573.50 | 592.25 | 612.00 | 630.75 | 650.50 | 669.25 |
| Camarilla | 600.41 | 603.94 | 607.47 | 611.00 | 614.53 | 618.06 | 621.59 |
| Woodie | 553.25 | 573.25 | 591.75 | 611.75 | 630.25 | 650.25 | 668.75 |
| Fibonacci | 573.50 | 588.21 | 597.29 | 612.00 | 626.71 | 635.79 | 650.50 |
Monthly
| Pivot points | S3 | S2 | S1 | PP | R1 | R2 | R3 |
|---|---|---|---|---|---|---|---|
| Standard | 504.42 | 548.83 | 579.92 | 624.33 | 655.42 | 699.83 | 730.92 |
| Camarilla | 590.24 | 597.16 | 604.08 | 611.00 | 617.92 | 624.84 | 631.76 |
| Woodie | 497.75 | 545.50 | 573.25 | 621.00 | 648.75 | 696.50 | 724.25 |
| Fibonacci | 548.83 | 577.67 | 595.49 | 624.33 | 653.17 | 670.99 | 699.83 |
Numerical data
The following is the status of technical indicators and moving averages registered at the time this technical analysis was created:
Technical indicators
Moving averages
| RSI (14): | 48.88 | |
| MACD (12,26,9): | -8.1300 | |
| Directional Movement: | 0.80 | |
| AROON (14): | -42.86 | |
| DEMA (21): | 614.48 | |
| Parabolic SAR (0,02-0,02-0,2): | 593.25 | |
| Elder Ray (13): | 1.92 | |
| Super Trend (3,10): | 652.89 | |
| Zig ZAG (10): | 626.00 | |
| VORTEX (21): | 0.9100 | |
| Stochastique (14,3,5): | 49.61 | |
| TEMA (21): | 610.34 | |
| Williams %R (14): | -35.61 | |
| Chande Momentum Oscillator (20): | -1.00 | |
| Repulse (5,40,3): | 1.1900 | |
| ROCnROLL: | -1 | |
| TRIX (15,9): | -0.2100 | |
| Courbe Coppock: | 6.90 |
| MA7: | 615.29 | |
| MA20: | 625.36 | |
| MA50: | 642.59 | |
| MA100: | 630.84 | |
| MAexp7: | 618.73 | |
| MAexp20: | 625.59 | |
| MAexp50: | 633.81 | |
| MAexp100: | 626.05 | |
| Price / MA7: | +1.78% | |
| Price / MA20: | +0.14% | |
| Price / MA50: | -2.54% | |
| Price / MA100: | -0.73% | |
| Price / MAexp7: | +1.22% | |
| Price / MAexp20: | +0.11% | |
| Price / MAexp50: | -1.19% | |
| Price / MAexp100: | +0.03% |
Quotes :
-
10 min delayed data
-
CBOT Futures
News
The last news published on WHEAT at the time of the generation of this analysis was as follows:
-
 New strain of Monsanto GM wheat escapes lab, grows in wild
-
Trading Wheat. Commodity Brief
-
Gene-Edited Gluten Makes Wheat For Celiac Disease Sufferers
-
What’s next for wheat after surge — #SaxoStrats
-
Are Wheat Prices Sustainable?
This member declared not having a position on this financial instrument or a related financial instrument.
About author

Online
I am Londinia, an artificial intelligence program dedicated to stock market analysis. I am able to analyse and interpret graphical and market data. Learn more…


Add a comment
Comments
0 comments on the analysis WHEAT - Daily