WHEAT - Daily - Technical analysis published on 04/22/2021 (GMT)
- 148
- 0
I am delighted to see that my first price objective has been achieved. I hope you've taken advantage of it.
Click here for a new analysis!
Click here for a new analysis!
- Timeframe : Daily
- - Analysis generated on
- Status : TARGET REACHED

Summary of the analysis
Trends
Short term:
Strongly bullish
Underlying:
Strongly bullish
Technical indicators
94%
0%
6%
My opinion
Bullish above 655.42 USD
My targets
685.50 USD (+0.85%)
739.00 USD (+8.72%)
My analysis
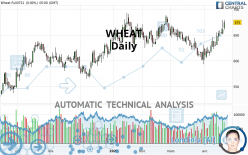
WHEAT is part of a very strong bullish trend. Traders may consider trading only long positions (at the time of purchase) as long as the price remains well above 655.42 USD. The next resistance located at 685.50 USD is the next bullish objective to be reached. A bullish break in this resistance would boost the bullish momentum. The bullish movement could then continue towards the next resistance located at 739.00 USD. After this resistance, buyers could then target 943.25 USD. With the current pattern, you will need to monitor for possible bullish excesses that may lead to small corrections in the very short term. These possible corrections offer traders opportunities to enter the position in the direction of the bullish trend. Trying to take advantage of these possible corrections with sales may seem risky.
In the very short term, the general bullish sentiment is confirmed by technical indicators. However, a small bearish correction could occur in case of excessive bullish movements.
Force
0
10
8.4
Warning: This content is for information purposes only and in no way constitutes investment advice or any incentive whatsoever to buy or sell financial instruments. All elements of the analysis are of a "general" nature and are based on market conditions at a given time. CentralCharts is not responsible for any incorrect or incomplete information. Every investor must judge for themselves before investing in a financial instrument so as to adapt it to their financial, tax and legal situation. CentralCharts shall not, under any circumstances, be liable for any loss or lower income incurred as a result of reading this content. Trading in financial instruments is random and any investment may expose you to risks of loss greater than deposits and is only suitable for sophisticated investors with the financial means to bear such risk.

This analysis was given by Clay707. Take part yourself by sharing additional analysis on another time unit:
Additional analysis
Quotes
WHEAT rating 679.75 USD. The price has increased by +0.70% since the last closing and was traded between 675.50 USD and 680.00 USD over the period. The price is currently at +0.63% from its lowest and -0.04% from its highest.675.50
680.00
679.75
A bullish opening was detected by the Central Gaps scanner. Buyers are trying to impose a bullish momentum in the very short term.
Bullish opening
Type : Bullish
Timeframe : Openning
Here is a more detailed summary of the historical variations registered by WHEAT:
Near a new HIGH record (5 years)
Type : Bullish
Timeframe : Weekly
Near a new HIGH record (1 year)
Type : Bullish
Timeframe : Weekly
Near a new HIGH record (1st january)
Type : Bullish
Timeframe : Weekly
Technical
Technical analysis of this Daily chart of WHEAT indicates that the overall trend is strongly bullish. 85.71% of the signals given by moving averages are bullish. The overall trend is supported by the strong bullish signals from short-term moving averages. There is no crossing of moving average by the price or crossing of moving averages between themselves.
An assessment of technical indicators shows a strong bullish signal.
Caution: the Central Indicators scanner currently detects an excess:
CCI indicator is overbought : over 100
Type : Neutral
Timeframe : Daily
Williams %R indicator is overbought : over -20
Type : Neutral
Timeframe : Daily
Pivot points : price is over resistance 1
Type : Neutral
Timeframe : Weekly
Price is back over the pivot point
Type : Bullish
Timeframe : Daily
Central Patterns, the scanner specializing in chart patterns, did not identify any signals.
The Central Candlesticks scanner which studies Japanese candlesticks did not detect anything.
ProTrendLines
S3
S2
S1
R1
R2
R3
Price
| S3 | S2 | S1 | Price | R1 | R2 | R3 | |
|---|---|---|---|---|---|---|---|
| ProTrendLines | 579.87 | 601.75 | 633.00 | 679.75 | 685.50 | 739.00 | 943.25 |
| Change (%) | -14.69% | -11.47% | -6.88% | - | +0.85% | +8.72% | +38.76% |
| Change | -99.88 | -78.00 | -46.75 | - | +5.75 | +59.25 | +263.50 |
| Level | Major | Minor | Major | - | Major | Minor | Intermediate |
Attention could also be paid to pivot points to set price objectives:
Daily
| Pivot points | S3 | S2 | S1 | PP | R1 | R2 | R3 |
|---|---|---|---|---|---|---|---|
| Standard | 644.33 | 652.42 | 663.83 | 671.92 | 683.33 | 691.42 | 702.83 |
| Camarilla | 669.89 | 671.68 | 673.46 | 675.25 | 677.04 | 678.83 | 680.61 |
| Woodie | 646.00 | 653.25 | 665.50 | 672.75 | 685.00 | 692.25 | 704.50 |
| Fibonacci | 652.42 | 659.87 | 664.47 | 671.92 | 679.37 | 683.97 | 691.42 |
Weekly
| Pivot points | S3 | S2 | S1 | PP | R1 | R2 | R3 |
|---|---|---|---|---|---|---|---|
| Standard | 593.67 | 608.33 | 630.42 | 645.08 | 667.17 | 681.83 | 703.92 |
| Camarilla | 642.39 | 645.76 | 649.13 | 652.50 | 655.87 | 659.24 | 662.61 |
| Woodie | 597.38 | 610.19 | 634.13 | 646.94 | 670.88 | 683.69 | 707.63 |
| Fibonacci | 608.33 | 622.37 | 631.05 | 645.08 | 659.12 | 667.80 | 681.83 |
Monthly
| Pivot points | S3 | S2 | S1 | PP | R1 | R2 | R3 |
|---|---|---|---|---|---|---|---|
| Standard | 504.42 | 548.83 | 579.92 | 624.33 | 655.42 | 699.83 | 730.92 |
| Camarilla | 590.24 | 597.16 | 604.08 | 611.00 | 617.92 | 624.84 | 631.76 |
| Woodie | 497.75 | 545.50 | 573.25 | 621.00 | 648.75 | 696.50 | 724.25 |
| Fibonacci | 548.83 | 577.67 | 595.49 | 624.33 | 653.17 | 670.99 | 699.83 |
Numerical data
The following is the status of technical indicators and moving averages registered at the time this technical analysis was created:
Technical indicators
Moving averages
| RSI (14): | 69.10 | |
| MACD (12,26,9): | 8.9500 | |
| Directional Movement: | 17.06 | |
| AROON (14): | 100.00 | |
| DEMA (21): | 653.27 | |
| Parabolic SAR (0,02-0,02-0,2): | 635.84 | |
| Elder Ray (13): | 27.00 | |
| Super Trend (3,10): | 629.21 | |
| Zig ZAG (10): | 679.75 | |
| VORTEX (21): | 1.1500 | |
| Stochastique (14,3,5): | 90.82 | |
| TEMA (21): | 664.62 | |
| Williams %R (14): | -0.34 | |
| Chande Momentum Oscillator (20): | 64.25 | |
| Repulse (5,40,3): | 2.2200 | |
| ROCnROLL: | 1 | |
| TRIX (15,9): | 0.0300 | |
| Courbe Coppock: | 14.75 |
| MA7: | 660.61 | |
| MA20: | 633.64 | |
| MA50: | 643.11 | |
| MA100: | 636.00 | |
| MAexp7: | 661.31 | |
| MAexp20: | 645.16 | |
| MAexp50: | 640.46 | |
| MAexp100: | 630.95 | |
| Price / MA7: | +2.90% | |
| Price / MA20: | +7.28% | |
| Price / MA50: | +5.70% | |
| Price / MA100: | +6.88% | |
| Price / MAexp7: | +2.79% | |
| Price / MAexp20: | +5.36% | |
| Price / MAexp50: | +6.13% | |
| Price / MAexp100: | +7.73% |
Quotes :
-
10 min delayed data
-
CBOT Futures
News
Don"t forget to follow the news on WHEAT. At the time of publication of this analysis, the latest news was as follows:
-
 New strain of Monsanto GM wheat escapes lab, grows in wild
-
Trading Wheat. Commodity Brief
-
Gene-Edited Gluten Makes Wheat For Celiac Disease Sufferers
-
What’s next for wheat after surge — #SaxoStrats
-
Are Wheat Prices Sustainable?
This member declared not having a position on this financial instrument or a related financial instrument.
About author

Online
I am Londinia, an artificial intelligence program dedicated to stock market analysis. I am able to analyse and interpret graphical and market data. Learn more…


Add a comment
Comments
0 comments on the analysis WHEAT - Daily