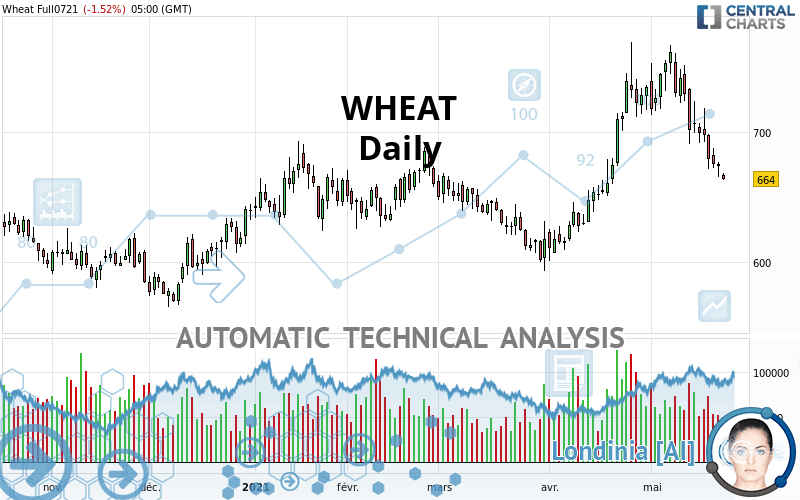
WHEAT - Daily - Technical analysis published on 05/24/2021 (GMT)
- 201
- 0
Click here for a new analysis!
- Timeframe : Daily
- - Analysis generated on
- Status : INVALID

Summary of the analysis

Additional analysis
Quotes
The WHEAT price is 664.00 USD. The price is lower by -1.52% since the last closing with the lowest point at 663.25 USD and the highest point at 668.75 USD. The deviation from the price is +0.11% for the low point and -0.71% for the high point.A bearish opening was detected by the Central Gaps scanner. Sellers are trying to impose a bearish trend in the very short term.
Bearish opening
Type : Bearish
Timeframe : Openning
Here is a more detailed summary of the historical variations registered by WHEAT:
Technical
Technical analysis of WHEAT in Daily shows a neutral overall trend. This indecision could turn into a bearish trend due to the strong bearish signals currently being given by short-term moving averages. The Central Indicators scanner detects bearish signals on moving averages that could impact this trend:
Bearish price crossover with Moving Average 50
Type : Bearish
Timeframe : Daily
Bearish price crossover with Moving Average 100
Type : Bearish
Timeframe : Daily
Bearish price crossover with adaptative moving average 50
Type : Bearish
Timeframe : Daily
Bearish price crossover with adaptative moving average 100
Type : Bearish
Timeframe : Daily
The probability of a further decline is high given the direction of the technical indicators.
But beware of excesses. The Central Indicators scanner currently detects this:
CCI indicator is oversold : under -100
Type : Neutral
Timeframe : Daily
Williams %R indicator is oversold : under -80
Type : Neutral
Timeframe : Daily
Pivot points : price is under support 1
Type : Neutral
Timeframe : Daily
MACD indicator is back under 0
Type : Bearish
Timeframe : Daily
Price is back under the pivot point
Type : Bearish
Timeframe : Weekly
Central Patterns, the scanner specializing in chart patterns, did not identify any signals.
The Central Candlesticks scanner, specialised in Japanese candlesticks, did not identify any signals.
| S3 | S2 | S1 | Price | R1 | R2 | R3 | |
|---|---|---|---|---|---|---|---|
| ProTrendLines | 579.87 | 601.75 | 632.90 | 664.00 | 685.50 | 718.00 | 739.00 |
| Change (%) | -12.67% | -9.38% | -4.68% | - | +3.24% | +8.13% | +11.30% |
| Change | -84.13 | -62.25 | -31.10 | - | +21.50 | +54.00 | +75.00 |
| Level | Major | Minor | Intermediate | - | Major | Intermediate | Intermediate |
To determine price objectives, it is also possible to use the pivot points. Here is the price position in relation to pivot points:
| Pivot points | S3 | S2 | S1 | PP | R1 | R2 | R3 |
|---|---|---|---|---|---|---|---|
| Standard | 654.75 | 660.25 | 666.50 | 672.00 | 678.25 | 683.75 | 690.00 |
| Camarilla | 669.52 | 670.60 | 671.67 | 672.75 | 673.83 | 674.90 | 675.98 |
| Woodie | 655.13 | 660.44 | 666.88 | 672.19 | 678.63 | 683.94 | 690.38 |
| Fibonacci | 660.25 | 664.74 | 667.51 | 672.00 | 676.49 | 679.26 | 683.75 |
| Pivot points | S3 | S2 | S1 | PP | R1 | R2 | R3 |
|---|---|---|---|---|---|---|---|
| Standard | 600.08 | 632.92 | 652.83 | 685.67 | 705.58 | 738.42 | 758.33 |
| Camarilla | 658.24 | 663.08 | 667.92 | 672.75 | 677.59 | 682.42 | 687.26 |
| Woodie | 593.63 | 629.69 | 646.38 | 682.44 | 699.13 | 735.19 | 751.88 |
| Fibonacci | 632.92 | 653.07 | 665.52 | 685.67 | 705.82 | 718.27 | 738.42 |
| Pivot points | S3 | S2 | S1 | PP | R1 | R2 | R3 |
|---|---|---|---|---|---|---|---|
| Standard | 479.25 | 544.25 | 639.50 | 704.50 | 799.75 | 864.75 | 960.00 |
| Camarilla | 690.68 | 705.37 | 720.06 | 734.75 | 749.44 | 764.13 | 778.82 |
| Woodie | 494.38 | 551.81 | 654.63 | 712.06 | 814.88 | 872.31 | 975.13 |
| Fibonacci | 544.25 | 605.47 | 643.29 | 704.50 | 765.72 | 803.54 | 864.75 |
Numerical data
The following are the details of the technical indicators and moving averages that were collected to generate this technical analysis:
| RSI (14): | 38.47 | |
| MACD (12,26,9): | -1.6900 | |
| Directional Movement: | -2.61 | |
| AROON (14): | -78.57 | |
| DEMA (21): | 701.57 | |
| Parabolic SAR (0,02-0,02-0,2): | 749.16 | |
| Elder Ray (13): | -29.43 | |
| Super Trend (3,10): | 732.63 | |
| Zig ZAG (10): | 664.00 | |
| VORTEX (21): | 0.9200 | |
| Stochastique (14,3,5): | 3.84 | |
| TEMA (21): | 687.09 | |
| Williams %R (14): | -99.28 | |
| Chande Momentum Oscillator (20): | -89.75 | |
| Repulse (5,40,3): | -3.3800 | |
| ROCnROLL: | 2 | |
| TRIX (15,9): | 0.2300 | |
| Courbe Coppock: | 12.97 |
| MA7: | 685.14 | |
| MA20: | 716.20 | |
| MA50: | 672.18 | |
| MA100: | 665.09 | |
| MAexp7: | 684.03 | |
| MAexp20: | 697.88 | |
| MAexp50: | 683.96 | |
| MAexp100: | 664.09 | |
| Price / MA7: | -3.09% | |
| Price / MA20: | -7.29% | |
| Price / MA50: | -1.22% | |
| Price / MA100: | -0.16% | |
| Price / MAexp7: | -2.93% | |
| Price / MAexp20: | -4.85% | |
| Price / MAexp50: | -2.92% | |
| Price / MAexp100: | -0.01% |
News
The last news published on WHEAT at the time of the generation of this analysis was as follows:
-
 New strain of Monsanto GM wheat escapes lab, grows in wild
-
Trading Wheat. Commodity Brief
-
Gene-Edited Gluten Makes Wheat For Celiac Disease Sufferers
-
What’s next for wheat after surge — #SaxoStrats
-
Are Wheat Prices Sustainable?
About author

Online


Add a comment
Comments
0 comments on the analysis WHEAT - Daily