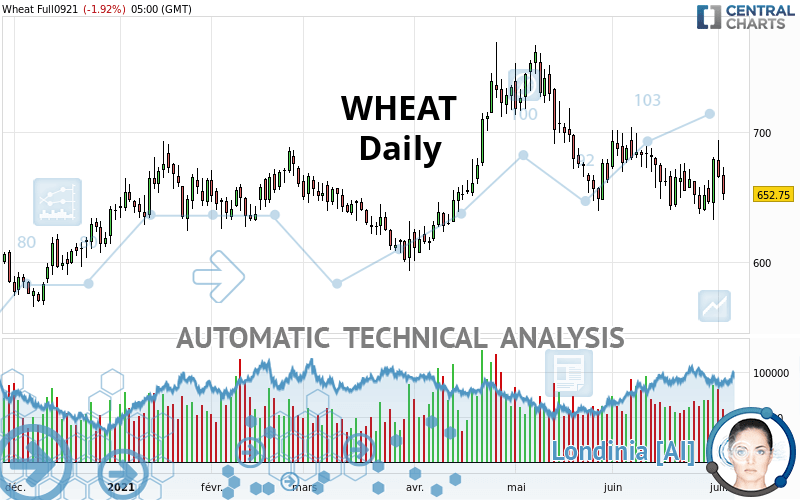
WHEAT - Daily - Technical analysis published on 07/03/2021 (GMT)
- 251
- 0
Click here for a new analysis!
- Timeframe : Daily
- - Analysis generated on
- Status : TARGET REACHED

Summary of the analysis

Additional analysis
Quotes
The WHEAT price is 652.75 USD. On the day, this instrument lost -1.92% and was traded between 648.25 USD and 673.00 USD over the period. The price is currently at +0.69% from its lowest and -3.01% from its highest.The Central Gaps scanner detects a bullish opening. A small advantage for buyers in the very short term.
Bullish opening
Type : Bullish
Timeframe : Openning
A study of price movements over other periods shows the following variations:
Technical
A technical analysis in Daily of this WHEAT chart shows a bearish trend. The signals given by moving averages are 71.43% bearish. This bearish trend is reinforced by the strong signals currently being given by short-term moving averages. An assessment of moving averages reveals several bearish signals that could impact this trend:
Bearish price crossover with Moving Average 20
Type : Bearish
Timeframe : Daily
Bearish price crossover with Moving Average 100
Type : Bearish
Timeframe : Daily
Bearish price crossover with adaptative moving average 50
Type : Bearish
Timeframe : Daily
Bearish price crossover with adaptative moving average 100
Type : Bearish
Timeframe : Daily
The technical indicators are generally neutral. They do not provide relevant information on the direction of future price movements.
Other results related to technical indicators were also found by the Central Indicators scanner:
Pivot points : price is under support 1
Type : Neutral
Timeframe : Daily
RSI indicator is back under 50
Type : Bearish
Timeframe : Daily
Parabolic SAR indicator bullish reversal
Type : Bullish
Timeframe : Daily
Aroon indicator bullish trend
Type : Bullish
Timeframe : Daily
Price is back under the pivot point
Type : Bearish
Timeframe : Weekly
The analysis of the price chart with Central Patterns scanners does not return any result.
For a small setback in the very short term, the Central Candlesticks scanner currently notes the presence of this bearish pattern in Japanese candlesticks:
Bearish harami
Type : Bearish
Timeframe : Daily
| S3 | S2 | S1 | Price | R1 | R2 | R3 | |
|---|---|---|---|---|---|---|---|
| ProTrendLines | 579.87 | 601.75 | 633.00 | 652.75 | 655.42 | 685.50 | 739.00 |
| Change (%) | -11.17% | -7.81% | -3.03% | - | +0.41% | +5.02% | +13.21% |
| Change | -72.88 | -51.00 | -19.75 | - | +2.67 | +32.75 | +86.25 |
| Level | Major | Minor | Major | - | Intermediate | Intermediate | Major |
To determine price objectives, it is also possible to use the pivot points. Here is the price position in relation to pivot points:
| Pivot points | S3 | S2 | S1 | PP | R1 | R2 | R3 |
|---|---|---|---|---|---|---|---|
| Standard | 617.25 | 632.75 | 642.00 | 657.50 | 666.75 | 682.25 | 691.50 |
| Camarilla | 644.44 | 646.71 | 648.98 | 651.25 | 653.52 | 655.79 | 658.06 |
| Woodie | 614.13 | 631.19 | 638.88 | 655.94 | 663.63 | 680.69 | 688.38 |
| Fibonacci | 632.75 | 642.21 | 648.05 | 657.50 | 666.96 | 672.80 | 682.25 |
| Pivot points | S3 | S2 | S1 | PP | R1 | R2 | R3 |
|---|---|---|---|---|---|---|---|
| Standard | 562.25 | 597.25 | 624.25 | 659.25 | 686.25 | 721.25 | 748.25 |
| Camarilla | 634.20 | 639.88 | 645.57 | 651.25 | 656.93 | 662.62 | 668.30 |
| Woodie | 558.25 | 595.25 | 620.25 | 657.25 | 682.25 | 719.25 | 744.25 |
| Fibonacci | 597.25 | 620.93 | 635.57 | 659.25 | 682.93 | 697.57 | 721.25 |
| Pivot points | S3 | S2 | S1 | PP | R1 | R2 | R3 |
|---|---|---|---|---|---|---|---|
| Standard | 558.75 | 595.50 | 630.50 | 667.25 | 702.25 | 739.00 | 774.00 |
| Camarilla | 645.77 | 652.35 | 658.92 | 665.50 | 672.08 | 678.65 | 685.23 |
| Woodie | 557.88 | 595.06 | 629.63 | 666.81 | 701.38 | 738.56 | 773.13 |
| Fibonacci | 595.50 | 622.91 | 639.84 | 667.25 | 694.66 | 711.59 | 739.00 |
Numerical data
The following is the status of the technical indicators and moving averages at the time of publication of this technical analysis:
| RSI (14): | 44.91 | |
| MACD (12,26,9): | -6.7300 | |
| Directional Movement: | -2.49 | |
| AROON (14): | 7.15 | |
| DEMA (21): | 654.56 | |
| Parabolic SAR (0,02-0,02-0,2): | 632.25 | |
| Elder Ray (13): | 0.34 | |
| Super Trend (3,10): | 713.62 | |
| Zig ZAG (10): | 651.25 | |
| VORTEX (21): | 0.9500 | |
| Stochastique (14,3,5): | 56.34 | |
| TEMA (21): | 651.68 | |
| Williams %R (14): | -69.35 | |
| Chande Momentum Oscillator (20): | -11.50 | |
| Repulse (5,40,3): | -3.8700 | |
| ROCnROLL: | 2 | |
| TRIX (15,9): | -0.1800 | |
| Courbe Coppock: | 5.10 |
| MA7: | 655.25 | |
| MA20: | 664.49 | |
| MA50: | 689.09 | |
| MA100: | 666.40 | |
| MAexp7: | 658.35 | |
| MAexp20: | 663.85 | |
| MAexp50: | 670.68 | |
| MAexp100: | 663.02 | |
| Price / MA7: | -0.38% | |
| Price / MA20: | -1.77% | |
| Price / MA50: | -5.27% | |
| Price / MA100: | -2.05% | |
| Price / MAexp7: | -0.85% | |
| Price / MAexp20: | -1.67% | |
| Price / MAexp50: | -2.67% | |
| Price / MAexp100: | -1.55% |
News
Don't forget to follow the news on WHEAT. At the time of publication of this analysis, the latest news was as follows:
-
 New strain of Monsanto GM wheat escapes lab, grows in wild
-
Trading Wheat. Commodity Brief
-
Gene-Edited Gluten Makes Wheat For Celiac Disease Sufferers
-
What’s next for wheat after surge — #SaxoStrats
-
Are Wheat Prices Sustainable?
About author

Online


Add a comment
Comments
0 comments on the analysis WHEAT - Daily