AUD/CAD - Daily - Technical analysis published on 03/04/2021 (GMT)
- 248
- 0
Click here for a new analysis!
- Timeframe : Daily
- - Analysis generated on
- Status : INVALID
Summary of the analysis

Additional analysis
Quotes
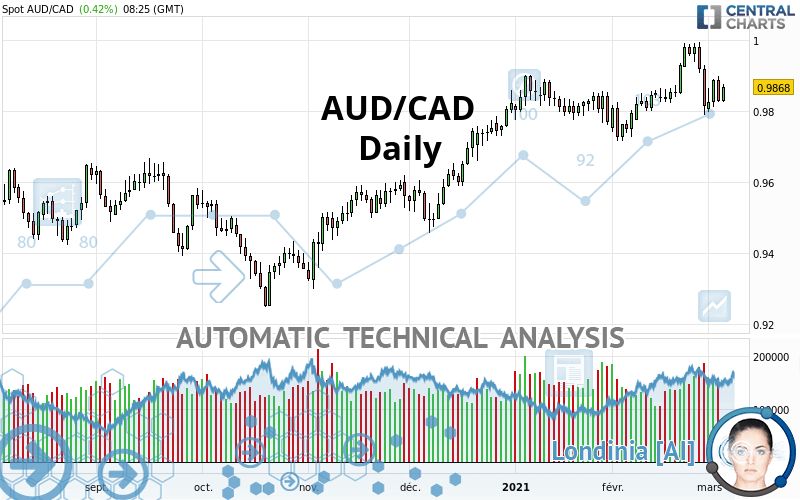
AUD/CAD rating 0.9868 CAD. On the day, this instrument gained +0.42% and was traded between 0.9826 CAD and 0.9875 CAD over the period. The price is currently at +0.43% from its lowest and -0.07% from its highest.A study of price movements over other periods shows the following variations:
Technical
Technical analysis of this Daily chart of AUD/CAD indicates that the overall trend is strongly bullish. 92.86% of the signals given by moving averages are bullish. The overall trend is supported by the strong bullish signals from short-term moving averages. The Central Indicators scanner detects bearish signals on moving averages that could impact this trend:
Bearish price crossover with Moving Average 20
Type : Bearish
Timeframe : Daily
Bearish price crossover with Moving Average 50
Type : Bearish
Timeframe : Daily
Bearish price crossover with adaptative moving average 20
Type : Bearish
Timeframe : Daily
Bearish price crossover with adaptative moving average 50
Type : Bearish
Timeframe : Daily
On the 18 technical indicators analysed, 3 are bullish, 10 are neutral and 5 are bearish. But beware of excesses. The Central Indicators scanner currently detects this:
Williams %R indicator is oversold : under -80
Type : Neutral
Timeframe : Daily
RSI indicator is back under 50
Type : Bearish
Timeframe : Daily
Price is back under the pivot point
Type : Bearish
Timeframe : Daily
Price is back under the pivot point
Type : Bearish
Timeframe : Weekly
Momentum indicator is back under 0
Type : Bearish
Timeframe : Daily
Central Patterns, the market scanner focusing on chart patterns, resistances and supports found this result:
Near support of channel
Type : Bullish
Timeframe : Daily
No result was found by the Central Candlesticks scanner on Japanese candlesticks.
| S3 | S2 | S1 | Price | R1 | R2 | R3 | |
|---|---|---|---|---|---|---|---|
| ProTrendLines | 0.9660 | 0.9726 | 0.9852 | 0.9868 | 0.9981 | 1.0337 | 1.0731 |
| Change (%) | -2.11% | -1.44% | -0.16% | - | +1.15% | +4.75% | +8.75% |
| Change | -0.0208 | -0.0142 | -0.0016 | - | +0.0113 | +0.0469 | +0.0863 |
| Level | Intermediate | Intermediate | Major | - | Major | Major | Intermediate |
Attention could also be paid to pivot points to set price objectives:
| Pivot points | S3 | S2 | S1 | PP | R1 | R2 | R3 |
|---|---|---|---|---|---|---|---|
| Standard | 0.9726 | 0.9775 | 0.9801 | 0.9850 | 0.9876 | 0.9925 | 0.9951 |
| Camarilla | 0.9806 | 0.9813 | 0.9820 | 0.9827 | 0.9834 | 0.9841 | 0.9848 |
| Woodie | 0.9715 | 0.9769 | 0.9790 | 0.9844 | 0.9865 | 0.9919 | 0.9940 |
| Fibonacci | 0.9775 | 0.9804 | 0.9821 | 0.9850 | 0.9879 | 0.9896 | 0.9925 |
| Pivot points | S3 | S2 | S1 | PP | R1 | R2 | R3 |
|---|---|---|---|---|---|---|---|
| Standard | 0.9533 | 0.9661 | 0.9738 | 0.9866 | 0.9943 | 1.0071 | 1.0148 |
| Camarilla | 0.9759 | 0.9777 | 0.9796 | 0.9815 | 0.9834 | 0.9853 | 0.9871 |
| Woodie | 0.9508 | 0.9648 | 0.9713 | 0.9853 | 0.9918 | 1.0058 | 1.0123 |
| Fibonacci | 0.9661 | 0.9739 | 0.9788 | 0.9866 | 0.9944 | 0.9993 | 1.0071 |
| Pivot points | S3 | S2 | S1 | PP | R1 | R2 | R3 |
|---|---|---|---|---|---|---|---|
| Standard | 0.9410 | 0.9562 | 0.9689 | 0.9841 | 0.9968 | 1.0120 | 1.0247 |
| Camarilla | 0.9738 | 0.9764 | 0.9789 | 0.9815 | 0.9841 | 0.9866 | 0.9892 |
| Woodie | 0.9397 | 0.9556 | 0.9676 | 0.9835 | 0.9955 | 1.0114 | 1.0234 |
| Fibonacci | 0.9562 | 0.9669 | 0.9735 | 0.9841 | 0.9948 | 1.0014 | 1.0120 |
Numerical data
The following is the status of the technical indicators and moving averages at the time of publication of this technical analysis:
| RSI (14): | 51.65 | |
| MACD (12,26,9): | 0.0017 | |
| Directional Movement: | -0.4655 | |
| AROON (14): | -7.1429 | |
| DEMA (21): | 0.9888 | |
| Parabolic SAR (0,02-0,02-0,2): | 0.9982 | |
| Elder Ray (13): | -0.0019 | |
| Super Trend (3,10): | 0.9814 | |
| Zig ZAG (10): | 0.9867 | |
| VORTEX (21): | 1.0911 | |
| Stochastique (14,3,5): | 35.12 | |
| TEMA (21): | 0.9878 | |
| Williams %R (14): | -60.98 | |
| Chande Momentum Oscillator (20): | 0.0035 | |
| Repulse (5,40,3): | -0.0160 | |
| ROCnROLL: | -1 | |
| TRIX (15,9): | 0.0363 | |
| Courbe Coppock: | 1.05 |
| MA7: | 0.9875 | |
| MA20: | 0.9865 | |
| MA50: | 0.9831 | |
| MA100: | 0.9668 | |
| MAexp7: | 0.9868 | |
| MAexp20: | 0.9862 | |
| MAexp50: | 0.9807 | |
| MAexp100: | 0.9712 | |
| Price / MA7: | -0.07% | |
| Price / MA20: | +0.03% | |
| Price / MA50: | +0.38% | |
| Price / MA100: | +2.07% | |
| Price / MAexp7: | -0% | |
| Price / MAexp20: | +0.06% | |
| Price / MAexp50: | +0.62% | |
| Price / MAexp100: | +1.61% |
News
Don"t forget to follow the news on AUD/CAD. At the time of publication of this analysis, the latest news was as follows:
-
 Australian Dollar China GDP Analysis: AUD/USD, AUD/JPY, GBP/AUD, AUD/CAD
-
Australian Dollar Analysis: AUD/USD, AUD/JPY, AUD/CAD Gain as RBA Holds in February
-
AUD/USD, AUD/JPY, AUD/CAD, AUD/NZD Analysis - Australia Jobs Report Coverage
-
RBA Coverage: AUD/USD, AUD/JPY, AUD/CAD, AUD/NZD Outlook with Daniel Dubrovsky
-
AUDCAD Primed For Break with Fewer Thematic Restrictions (Quick Take Video)
About author

Online


Add a comment
Comments
0 comments on the analysis AUD/CAD - Daily