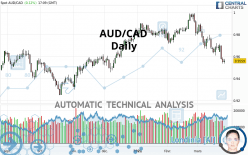
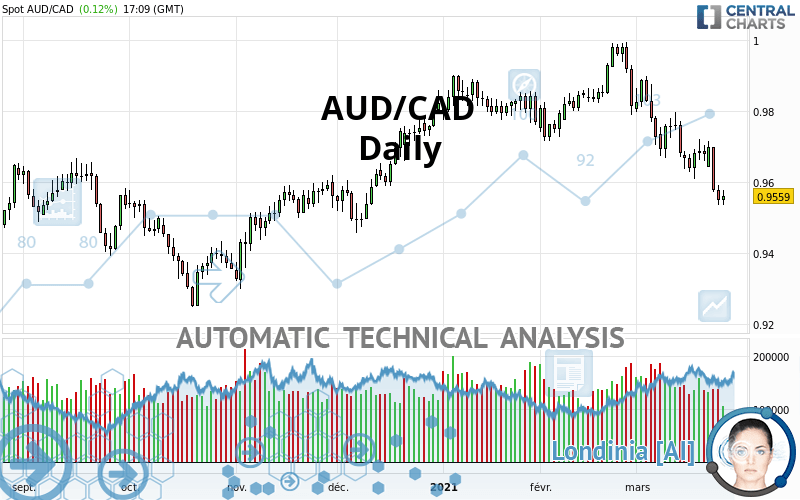
AUD/CAD - Daily - Technical analysis published on 03/25/2021 (GMT)
- 333
- 0
Click here for a new analysis!
- Timeframe : Daily
- - Analysis generated on
- Status : TARGET REACHED
Summary of the analysis

Additional analysis
Quotes
The AUD/CAD price is 0.9559 CAD. On the day, this instrument gained +0.12% and was traded between 0.9535 CAD and 0.9578 CAD over the period. The price is currently at +0.25% from its lowest and -0.20% from its highest.The Central Gaps scanner detects a bullish opening marking the presence of buyers ahead of sellers at the opening but not sufficiently marked to allow the price to register a quotation gap.
Bullish opening
Type : Bullish
Timeframe : Openning
Here is a more detailed summary of the historical variations registered by AUD/CAD:
Near a new HIGH record (1st january)
Type : Bullish
Timeframe : Weekly
Near a new HIGH record (1 month)
Type : Bullish
Timeframe : Weekly
Technical
A technical analysis in Daily of this AUD/CAD chart shows a bearish trend. The signals given by moving averages are 75.00% bearish. This bearish trend is reinforced by the strong signals currently being given by short-term moving averages. The Central Indicators market scanner currently does not detect any result that concerns moving averages.
Technical indicators are strongly bearish, suggesting that the price decline is expected to continue.
Caution: the Central Indicators scanner currently detects an excess:
CCI indicator is oversold : under -100
Type : Neutral
Timeframe : Daily
MACD indicator: bullish divergence
Type : Bullish
Timeframe : Daily
Williams %R indicator is oversold : under -80
Type : Neutral
Timeframe : Daily
Pivot points : price is over resistance 1
Type : Neutral
Timeframe : Daily
Pivot points : price is under support 3
Type : Neutral
Timeframe : Daily
Pivot points : price is under support 3
Type : Neutral
Timeframe : Weekly
Central Patterns, the market scanner focusing on chart patterns, resistances and supports found these results:
Near horizontal support
Type : Bullish
Timeframe : Daily
Support of channel is broken
Type : Bearish
Timeframe : Daily
The Central Candlesticks scanner, specialised in Japanese candlesticks, did not identify any signals.
| S3 | S2 | S1 | Price | R1 | R2 | R3 | |
|---|---|---|---|---|---|---|---|
| ProTrendLines | 0.9325 | 0.9437 | 0.9496 | 0.9559 | 0.9594 | 0.9660 | 0.9726 |
| Change (%) | -2.45% | -1.28% | -0.66% | - | +0.37% | +1.06% | +1.75% |
| Change | -0.0234 | -0.0122 | -0.0063 | - | +0.0035 | +0.0101 | +0.0167 |
| Level | Minor | Minor | Intermediate | - | Minor | Intermediate | Major |
Pivot points can also be used to set your price objectives. Here is the price situation in relation to pivot points:
| Pivot points | S3 | S2 | S1 | PP | R1 | R2 | R3 |
|---|---|---|---|---|---|---|---|
| Standard | 0.9469 | 0.9502 | 0.9525 | 0.9558 | 0.9581 | 0.9614 | 0.9637 |
| Camarilla | 0.9533 | 0.9538 | 0.9543 | 0.9548 | 0.9553 | 0.9558 | 0.9563 |
| Woodie | 0.9464 | 0.9500 | 0.9520 | 0.9556 | 0.9576 | 0.9612 | 0.9632 |
| Fibonacci | 0.9502 | 0.9523 | 0.9537 | 0.9558 | 0.9579 | 0.9593 | 0.9614 |
| Pivot points | S3 | S2 | S1 | PP | R1 | R2 | R3 |
|---|---|---|---|---|---|---|---|
| Standard | 0.9507 | 0.9558 | 0.9618 | 0.9669 | 0.9729 | 0.9780 | 0.9840 |
| Camarilla | 0.9648 | 0.9658 | 0.9668 | 0.9678 | 0.9688 | 0.9698 | 0.9709 |
| Woodie | 0.9512 | 0.9560 | 0.9623 | 0.9671 | 0.9734 | 0.9782 | 0.9845 |
| Fibonacci | 0.9558 | 0.9600 | 0.9627 | 0.9669 | 0.9711 | 0.9738 | 0.9780 |
| Pivot points | S3 | S2 | S1 | PP | R1 | R2 | R3 |
|---|---|---|---|---|---|---|---|
| Standard | 0.9410 | 0.9562 | 0.9689 | 0.9841 | 0.9968 | 1.0120 | 1.0247 |
| Camarilla | 0.9738 | 0.9764 | 0.9789 | 0.9815 | 0.9841 | 0.9866 | 0.9892 |
| Woodie | 0.9397 | 0.9556 | 0.9676 | 0.9835 | 0.9955 | 1.0114 | 1.0234 |
| Fibonacci | 0.9562 | 0.9669 | 0.9735 | 0.9841 | 0.9948 | 1.0014 | 1.0120 |
Numerical data
The following is the status of the technical indicators and moving averages at the time of publication of this technical analysis:
| RSI (14): | 33.57 | |
| MACD (12,26,9): | -0.0062 | |
| Directional Movement: | -20.9326 | |
| AROON (14): | -71.4286 | |
| DEMA (21): | 0.9624 | |
| Parabolic SAR (0,02-0,02-0,2): | 0.9699 | |
| Elder Ray (13): | -0.0104 | |
| Super Trend (3,10): | 0.9763 | |
| Zig ZAG (10): | 0.9564 | |
| VORTEX (21): | 0.7484 | |
| Stochastique (14,3,5): | 5.76 | |
| TEMA (21): | 0.9573 | |
| Williams %R (14): | -89.31 | |
| Chande Momentum Oscillator (20): | -0.0194 | |
| Repulse (5,40,3): | -0.6293 | |
| ROCnROLL: | 2 | |
| TRIX (15,9): | -0.0675 | |
| Courbe Coppock: | 3.65 |
| MA7: | 0.9632 | |
| MA20: | 0.9712 | |
| MA50: | 0.9786 | |
| MA100: | 0.9714 | |
| MAexp7: | 0.9616 | |
| MAexp20: | 0.9696 | |
| MAexp50: | 0.9741 | |
| MAexp100: | 0.9698 | |
| Price / MA7: | -0.76% | |
| Price / MA20: | -1.58% | |
| Price / MA50: | -2.32% | |
| Price / MA100: | -1.60% | |
| Price / MAexp7: | -0.59% | |
| Price / MAexp20: | -1.41% | |
| Price / MAexp50: | -1.87% | |
| Price / MAexp100: | -1.43% |
News
The last news published on AUD/CAD at the time of the generation of this analysis was as follows:
-
 Australian Dollar China GDP Analysis: AUD/USD, AUD/JPY, GBP/AUD, AUD/CAD
-
Australian Dollar Analysis: AUD/USD, AUD/JPY, AUD/CAD Gain as RBA Holds in February
-
AUD/USD, AUD/JPY, AUD/CAD, AUD/NZD Analysis - Australia Jobs Report Coverage
-
RBA Coverage: AUD/USD, AUD/JPY, AUD/CAD, AUD/NZD Outlook with Daniel Dubrovsky
-
AUDCAD Primed For Break with Fewer Thematic Restrictions (Quick Take Video)
About author

Online


Add a comment
Comments
0 comments on the analysis AUD/CAD - Daily